Abstract
Parkinson’s disease (PD) and inflammatory bowel disease (IBD) are chronic diseases affecting the central nervous system and gastrointestinal tract, respectively. Recent research suggests a bidirectional relationship between neurodegeneration in PD and intestinal inflammation in IBD. PD patients may experience gastrointestinal dysfunction over a decade before motor symptom onset, and IBD may increase the risk of developing PD. Despite the “gut-brain axis” concept, the underlying pathophysiological mechanisms of this potential association remain unclear. This study aimed to investigate the biological mechanisms of differentially expressed genes in PD and IBD using bioinformatics tools, providing novel insights into the co-diagnosis and treatment of these diseases. We constructed a gene marker for disease diagnosis and identified five important genes (BTK, NCF2, CRH, FCGR3A and SERPINA3). Through nomogram and decision tree analyses, we found that both the IBD and PD required only the expression levels of BTK and NCF2 for accurate discrimination. Additionally, small molecule drugs RO-90-7501 and MST-312 may be useful for the treatment of both IBD and PD. These findings offer new perspectives on the co-diagnosis and treatment of PD and IBD, and suggest that targeting BTK may be a promising therapeutic strategy for both diseases.
Introduction
Parkinson’s disease (PD) is a chronic neurodegenerative disorder characterized by the degeneration of dopaminergic neurons in the substantia nigra pars compacta, leading to motor dysfunction. Common symptoms include resting tremor, muscle rigidity, bradykinesia and postural instability1,2. The disease is named after James Parkinson, a British physician who first described its symptoms in 1817. It affects approximately 1% of the population over the age of 60, and its prevalence is projected to double over the next 30 years3. Pathologically, PD is characterized by the presence of Lewy bodies, which are composed of aggregated alpha-synuclein protein. Recent research suggests that PD may originate from chronic inflammation in the gastrointestinal tract, leading to the misfolding of alpha-synuclein and its propagation to the brain via the blood–brain barrier or the vagus nerve4,5. Current treatment for PD primarily relies on medications, such as those that increase dopamine levels, and in some cases, surgical interventions such as deep brain stimulation may be considered6,7. While there is no cure for PD, early diagnosis and comprehensive management can effectively alleviate symptoms and improve patients’ quality of life.
Inflammatory bowel disease (IBD) is a chronic, relapsing inflammatory condition of the gastrointestinal tract, encompassing ulcerative colitis (UC) and Crohn’s disease (CD). Patients with IBD often present with symptoms such as abdominal pain, diarrhea, bloody stools and weight loss. Diagnosis involves a combination of medical history, clinical symptoms, imaging studies and histopathological examination8,9. Treatment strategies include anti-inflammatory medications, immunosuppressive drugs, nutritional support and surgical interventions10,11. Early epidemiological studies have demonstrated a significantly increased risk of PD in patients with IBD, and biological evidence suggests that chronic low-grade intestinal inflammation in IBD may contribute to the pathogenesis of PD by disrupting the intestinal and blood–brain barriers and triggering neuroinflammation12,13. With the advent of the gut-brain axis concept, the potential interplay between inflammation in PD and IBD has become a topic of growing interest. Genome-wide association studies have further revealed shared genetic risk variants between the two diseases, providing a genetic basis for their comorbidity14.
Both PD and IBD are chronic conditions that require long-term management and treatment. Early diagnosis and aggressive therapy can help alleviate symptoms, reduce inflammation and improve overall quality of life. Despite the differences in their clinical presentations and underlying pathophysiology, PD and IBD share certain similarities15,16. Inflammation is likely to play a role in the development and progression of both diseases. Common inflammatory mediators may facilitate the interaction between the two conditions, suggesting the presence of interconnected biological mechanisms17,18. Therefore, this study aimed to identify common biomarkers of PD and IBD using publicly available Gene Expression Omnibus (GEO) datasets and compare multiple machine learning models to obtain optimal models for PD and IBD. By exploring potential therapeutic targets, this study seeks to provide novel insights into the co-diagnosis and treatment of PD and IBD.
Materials and methods
Data download
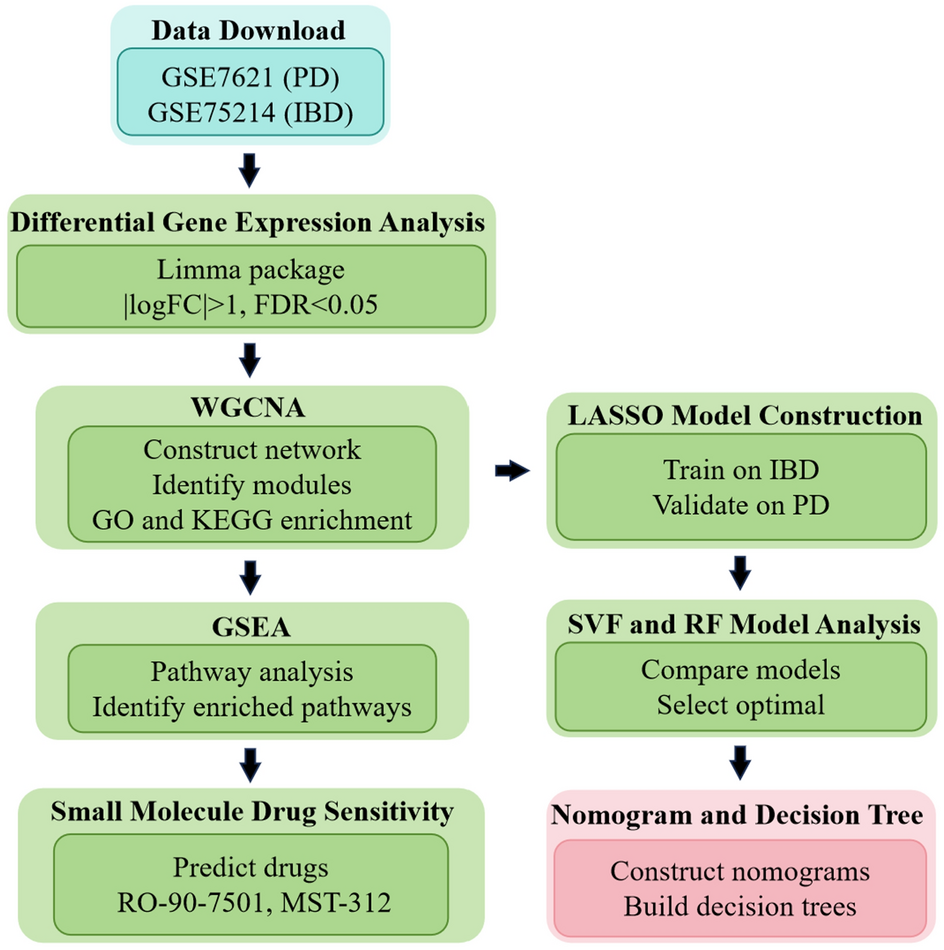
The overall workflow of our data analysis was illustrated in Fig. 1. The GSE7621 dataset, obtained from the GEO database (http://www.ncbi.nlm.nih.gov/geo), comprises data from substantia nigra tissue from postmortem brains of 16 PD patients (age range: 60–88 years, 11 males and 5 females) and 9 healthy individuals (age range: 46–88 years, 4 males and 5 females). Additionally, the GSE75214 dataset, also retrieved from GEO, includes data from mucosal biopsies obtained from the colon of 105 IBD patients (age range: 29–56 years, 57 males and 48 females, with 97 UC and 8 CD patients) and 11 healthy controls (age range: 62–73 years, 5 males and 6 females).

Flowchart diagram of search strategy.
Identification of differentially expressed genes associated with IBD and PD
Differential gene expression analysis between IBD/PD and normal tissues was performed using the Limma software package. Genes exhibiting absolute log fold change (|logFC|) > 1 and false discovery rate (FDR) < 0.05 were considered differentially expressed. Subsequently, the top 10 upregulated and downregulated genes were identified and clustered using the pheatmap package.
Weighted gene co-expression network analysis (WGCNA)
A gene co-expression network was constructed for the GSE7621 dataset using the R WGCNA package. Initially, the goodSamplesGenes function was employed to filter out missing genes and samples. Subsequently, the hclust function was utilized to cluster the samples and identify outlier samples for removal. Traditional methods for analyzing gene associations rely on calculating correlation coefficients, which necessitate the arbitrary definition of a threshold to determine similarity. WGCNA overcomes this limitation by introducing the concept of soft thresholding, which is optimized using the pickSoftThreshold function. The blockwiseModules function was then employed for network construction and module detection, grouping genes with similar expression patterns into modules. The correlation between each module and the phenotype was computed, and the module-correlation heat map was visualized using the labeledHeatmap function. Co-expressed module genes exhibiting the highest correlation with clinical characteristics were selected for Gene Ontology (GO) and Kyoto Encyclopedia of Genes and Genomes (KEGG) enrichment analysis. To identify potential biomarkers for PD, the gene significance (GS) and module membership (MM) of genes within the selected modules were calculated. Genes with GS > 0.6 and MM > 0.6 were considered potential markers. To obtain genes related to both IBD and PD, the intersection of IBD and PD differentially expressed genes and co-expression module genes was identified for subsequent analysis.
Clarification on Methodology Choice: In this study, we employed WGCNA specifically on the PD dataset to identify gene co-expression modules associated with PD. This approach was chosen to focus on the distinct molecular mechanisms underlying neurodegeneration in PD. For the IBD dataset, we utilized differential gene expression analysis to identify relevant genes. However, we acknowledge that applying WGCNA to the IBD dataset could provide additional insights into the co-expression networks in IBD. Future studies should consider employing WGCNA on both datasets to uncover a more comprehensive understanding of the gene co-expression networks involved in both diseases.
Gene set enrichment analysis (GSEA)
To elucidate the signaling pathways associated with differentially expressed genes, GSEA was conducted using the GSEA software (version 4.0.3) and the c5.go.bp.v2022.1.Hs.symbols.gmt gene set. GSEA was performed on the gene expression matrix with 1000 permutations, and the resulting enrichment scores and corresponding pathways were obtained.
Least absolute shrinkage and selection operator (LASSO) model construction
To identify markers capable of distinguishing PD from healthy controls among candidate genes, a Lasso regression model was constructed using the R glment package. The model generates a sample index function: index = gene1 × coef1 + gene2 × coef2 + gene3 × coef3 + …, where “coef” represents the regression coefficient of a gene. The model was trained on the IBD dataset GSE36807 and validated on the PD dataset GSE8397. The predictive performance of the model was evaluated using receiver operating characteristic (ROC) curves generated with the pROC package.
Support vector machines (SVM) and random forest (RF) models
Based on the features identified by Lasso screening, RF and SVM models were constructed using the randomForest and kernlab packages, respectively. The models were evaluated using ROC curves, cumulative distribution plots of residuals, and boxplots of residuals. Subsequently, the genes were ranked based on their importance in the models. The top 5 genes were selected to form a gene signature, which was validated using independent IBD and PD patient datasets.
Nomogram and decision tree construction
A nomogram was constructed using the rms package based on the top 5 genes ranked by importance. The nomogram calculates a score for each sample based on the expression levels of the five genes. The total score is the sum of the individual gene scores. Higher scores indicate a higher probability of being an IBD/PD patient. The predictive accuracy of the nomogram was evaluated using a calibration curve. Additionally, a decision tree pattern diagram was drawn using the reprtree package to visualize the gene signature judgment rules.
Consensus clustering
Consensus clustering is an unsupervised clustering approach commonly employed for patient subtype classification. In this study, we applied consensus clustering to the PD-associated differential gene expression matrix to divide PD samples into two subtypes. Comparative analysis was performed between the different subtypes to assess their distinctiveness. This analysis aimed to identify unique characteristics and potential biomarkers associated with each subtype of PD patients.
Small molecule drug sensitivity prediction
To identify potential drug candidates for IBD/PD, we utilized the Connectivity Map (CMap) database. We input the upregulated and downregulated genes between IBD/PD patients and healthy controls into the database. The top 15 and bottom 15 results, ranked by median_tau_score, were selected for further analysis. The median_tau_score represents the similarity between the gene expression profile of a drug treatment and the gene expression profile of a disease state. A high median_tau_score indicates that a drug may be effective in treating a particular disease. The 3D structures of the candidate drugs were visualized using the PubChem database. This visualization provides insights into the molecular structure and potential binding sites of the drugs.
Results
Identification of differentially expressed genes associated with IBD and PD
The sva package was employed to correct batch effects in the datasets (GSE7621, GSE75214). Subsequently, the gene names corresponding to the probes were obtained using the GPL570 and GPL6244 probe annotation files for PD and IBD datasets, respectively. Redundant probes mapping to the same gene were removed, resulting in a total of 22,880 genes for the PD dataset and 41,115 genes for the IBD dataset. Differential gene expression analysis was performed between PD patients and healthy controls using a threshold of fold change ≥ 1 and p-value ≤ 0.05. This analysis identified 199 differentially expressed genes, including 25 upregulated and 174 downregulated genes (Fig. 2A). A heat map was generated to visualize the expression patterns of the top 10 upregulated and downregulated genes in PD patients and healthy controls (Fig. 2B). Similarly, differential gene expression analysis was conducted between IBD patients and healthy controls. This analysis identified 259 differentially expressed genes, including 148 upregulated and 111 downregulated genes (Fig. 2C). A heat map was generated to visualize the expression patterns of the top 10 upregulated and downregulated genes in IBD patients and healthy controls (Fig. 2D).

Identification of differentially expressed genes associated with IBD and PD. (A). Volcano plot showing the results of differential gene expression analysis between PD patients and healthy controls based on the integrated gene expression profiles from GSE7621. (B). Heatmap showing the expression changes of the top 10 upregulated and downregulated differentially expressed genes in PD compared to healthy controls. (C). Volcano plot showing the results of differential gene expression analysis between IBD patients and healthy controls based on gene expression profiles from GSE75214. (D). Heatmap showing the expression changes of the top 10 upregulated and downregulated differentially expressed genes in IBD compared to healthy controls.
WGCNA gene weighted co-expression analysis
Following data integration, the expression data for the PD dataset was preprocessed. The variance of each gene across samples was calculated, and the top 75% of genes with the highest variance were selected for downstream analysis. Hierarchical clustering of samples was performed using the hclust function to identify outliers. One sample was identified as an outlier and removed from subsequent analysis (Fig. 3A). WGCNA requires the selection of an appropriate soft threshold to ensure that the gene network follows a scale-free network distribution. A soft threshold of 8 was determined to achieve a scale independence of 0.8 and a mean connectivity close to 0, indicating that the gene network approximated a scale-free network. Using the selected soft threshold, the weighted correlation coefficients between genes were calculated and converted into an adjacency matrix. The Topological Overlap Matrix was then constructed. Hierarchical clustering was performed on the TOM to identify distinct gene modules, with a minimum module size of 30. A total of 20 modules were obtained, with gray modules representing genes not assigned to any module (Fig. 3B). Characteristic genes were extracted for each module, and the correlation between each module and clinical characteristics (alive, dead, overall survival) was calculated based on the characteristic genes. The focus was on understanding the correlation between modules and PD patients. A heatmap was generated to visualize the correlation between modules and clinical characteristics, revealing that the blue module had the highest correlation with PD (Fig. 3C). To further investigate the relationship between the blue module and PD, a scatter plot of GS and MM was generated. The genes in the blue module showed a significant correlation with PD (r = 0.32, p = 2e−07) (Fig. 3D). GO enrichment analysis was performed on the co-expressed genes within the blue module. The enriched biological processes included positive regulation of cytokine production, leukocyte-mediated immunity and positive regulation of response to external stimulus. The enriched cell components included secretory granule membrane, endocytic vesicle and endocytic vesicle membrane. The enriched molecular functions included peptide binding, immune receptor activity and peptide antigen binding (Fig. 3E).

WGCNA was performed on the integrated PD expression data to identify co-expressed gene modules. (A). Clustering tree obtained using the hclust function to identify sample outliers after preprocessing the PD expression data. (B). WGCNA results showing the dendrogram of co-expression modules and the module eigengenes. (C). Heatmap illustrating the correlation between co-expression modules and clinical characteristics (alive, dead, overall survival). (D). Scatter plot depicting the correlation between gene significance and module membership for the blue module. Genes with higher significance are more likely to be hub genes within the module. (E). Biological processes, cell components, and molecular functions enriched in the coexpressed genes within the blue module.
GSEA enrichment analysis
GSEA enrichment analysis of differentially expressed genes in PD patients revealed downregulation of the following pathways: response to corticosterone, glucosamine-containing compound metabolic process, amino sugar catalytic process and regulation of lymphocyte chemotaxis (Fig. 4A–C,F). Conversely, grooming behavior and positive regulation of glutamate secretion pathway were upregulated in PD patients (Fig. 4D,E).

GSEA was performed to identify enriched pathways in PD patients compared to healthy controls. (A–C, F). GSEA enrichment analysis results depicting down-regulated pathways in PD patients. (D–E). GSEA enrichment analysis results illustrating up-regulated pathways in PD patients.
IBD and PD common differentially expressed gene enrichment analysis
First, we constructed a Venn diagram to visualize the overlap between PD blue module genes, IBD differential genes and PD differential genes (Fig. 5A). This analysis revealed that 11 genes were shared among the three gene sets. Next, we explored the functional implications of these shared genes. GO enrichment analysis was performed, categorizing the genes into three domains: biological process, cellular component and molecular function. The results indicated that the enriched biological processes included acute inflammatory response, immunoglobulin-mediated immune response and Fc receptor signaling pathway. Enriched molecular functions included immune receptor activity, IgG binding and immunoglobulin binding (Fig. 5B). KEGG pathway enrichment analysis further revealed that these shared genes were significantly enriched in metabolic pathways such as osteoclast differentiation, Fc epsilon RI signaling pathway and leishmaniasis (Fig. 5C). We also investigated the functions of PD differential genes specifically. GO enrichment analysis showed that these genes were enriched in biological processes related to signal release, embryonic organ development and gland development. Enriched cellular components included actin cytoskeleton, neuronal cell body and cell-substrate junction. Enriched molecular functions included DNA-binding transcription factor binding, DNA-binding transcription activator activity and DNA-binding transcription activator activity (Fig. 5D). KEGG pathway enrichment analysis of PD differential genes identified enrichment in TNF-alpha signaling via NF-κB, hypoxia and inflammatory response pathways (Fig. 5E).

GO and KEGG enrichment analyses were performed to identify enriched pathways and biological processes associated with the common differentially expressed genes between PD and IBD. (A). Venn diagram illustrating the overlap of genes in the blue module of PD, differential genes in IBD and PD differential genes. (B). GO enrichment analysis results for the common genes. (C). KEGG enrichment analysis results for the common genes. (D). Functional analysis results for PD differential genes. (E). KEGG enrichment analysis results for PD-related differential genes.
Lasso model building
Based on the WGCNA, we identified 19 candidate genes significantly associated with PD. Subsequent LASSO analysis was performed to select the optimal lambda value, resulting in a signature consisting of 23 genes (Fig. 6A,B). ROC curve analysis of the LASSO model in the IBD dataset demonstrated an area under the curve of 0.942 (Fig. 6C), indicating excellent discriminatory ability for IBD patients. In the PD dataset, the AUC was 0.75 (Fig. 6D), suggesting moderate discriminatory ability for PD patients. These findings indicate that the LASSO model composed of these 23 genes has potential as a diagnostic biomarker for both IBD and PD.

Lasso regression analysis was performed to identify a robust gene signature for PD. (A). Results of Lasso analysis displaying the selection of the optimal λ value for PD. (B). The construction of a signature consisting of 23 genes. (C). ROC curve analysis of the Lasso model in IBD data, demonstrating the model’s ability to distinguish between IBD patients and healthy controls. (D). ROC curve analysis of the Lasso model in PD data, showing the model’s ability to differentiate between PD patients and healthy controls.
Support vector machine and random forest model analysis
Utilizing the LASSO model, we identified 23 genes associated with IBD and PD patients. Subsequently, we constructed RF and SVM models independently. Analysis of the residual cumulative distribution and box plots for the LASSO, RF and SVM models revealed that the RF model exhibited smaller residual values compared to the SVM and LASSO models (Fig. 7A,B). This indicates that the RF model is the most suitable for our dataset. We further evaluated the importance of each gene and ranked them accordingly. The top 10 most important genes are presented in Fig. 7C. Finally, we validated the RF model independently in the IBD and PD datasets. ROC analysis demonstrated an AUC of 1.0 for IBD patients (Fig. 7D), indicating perfect discrimination, and an AUC of 0.992 for PD patients (Fig. 7E), indicating excellent discrimination.

Support Vector Machine and Random Forest Model Analysis. (A). Residual cumulative distribution comparing the Lasso, RF and SVM models. (B). Box plots comparing the Lasso, RF and SVM models. (C). Importance analysis of genes in the RF model, highlighting the top 10 important genes. (D). ROC curve analysis of the RF model in IBD patients. (E). ROC curve analysis of the RF model in PD patients.
Nomogram and decision tree analysis
Based on the gene importance rankings, we selected the top 5 genes (BTK, NCF2, CRH, FCGR3A and SERPINA3) to construct nomograms for aiding in the clinical diagnosis of IBD and PD patients (Fig. 8A,C). Calibration curves were generated to assess the accuracy of the nomogram models in predicting the positive rates of IBD and PD. The results showed good agreement between the predicted and actual positive rates (Fig. 8B,D). We further analyzed the expression of these 5 genes in IBD patients compared to healthy controls. BTK was found to be downregulated in IBD patients, while NCF2, CRH, FCGR3A and SERPINA3 were upregulated (Fig. 8E). Similarly, we examined the expression of these 5 genes in PD patients compared to healthy controls. BTK, FCGR3A and SERPINA3 were upregulated in PD patients, while NCF2 and CRH were downregulated (Fig. 8F).

Support Vector Machine and Random Forest Model Analysis. Nomograms constructed using the top 5 genes to facilitate clinical diagnosis of (A) IBD and (C) PD patients. The nomograms provide a visual representation of the relationship between the gene expression levels and the probability of disease. Calibration curves illustrating the accuracy of the nomogram models in predicting the positive rates of IBD (B) and PD (D). E. Expression analysis of the top 5 genes in IBD patients compared to healthy individuals. (F). Expression analysis of the top 5 genes in PD patients compared to healthy individuals.
In addition, we constructed decision trees using these 5 genes to differentiate IBD/PD patients from healthy controls. The results showed that both the IBD and PD decision trees required only the expression levels of BTK and NCF2 for accurate discrimination (Fig. S1).
Small molecule drug sensitivity analysis
To identify potential therapeutic interventions for PD/IBD patients, we also utilized the Connectivity Map (CMap) database to analyze the effects of small molecule drugs. Differential genes were input into the CMap website to predict candidate drugs. Based on median_taus, 15 distinct perturbagens, including genes and knocked down genes, were selected. The results suggest that to improve therapeutic outcomes in PD/IBD patients, the expression of genes such as CTNNBIP1, SLC16A3, PTPN11 and FDX1L should be knocked out or downregulated. Additionally, the drugs RO-90-7501 and MST-312 may be beneficial. Conversely, the knockout or downregulation of genes such as CSNK1G2, IL6, CDK7 and MPDZ is associated with worse patient prognosis. Similarly, the overexpression of SHC1, PSEN1 and CORO1A genes and the use of the drug MK-1775 are also linked to poor outcomes (Fig. S2A). The three-dimensional structures of the small molecule drugs RO-90-7501, MST-312 and MK-1775 were analyzed using the PubChem database (Fig. S2B–D).
Consensus cluster analysis identifies PD subtypes
PD is a heterogeneous disorder with multiple pathobiological subtypes. To identify these subtypes, we employed consensus clustering analysis to partition PD patients into distinct subgroups. Analysis of the cumulative distribution function (CDF) and consensus matrix revealed that K = 2 yielded the smallest CDF value and minimal correlation between groups (Fig. 9A,B). Therefore, we selected K = 2, resulting in the division of PD patients into two subgroups (Fig. 9C,D). Differential gene expression analysis between the two subgroups identified 74 downregulated genes and 122 upregulated genes. Enrichment analysis of these differentially expressed genes revealed significant enrichment in biological processes related to cell junction assembly, autophagic structure homeostasis and vesicle-mediated transport in synapses. Enriched cellular components included presynapse, GABAergic synapse and distal axon. Enriched molecular functions included postsynaptic neurotransmitter receptor activity, GABA-A receptor activity and GABA receptor activity (Fig. 9E). KEGG pathway analysis identified enrichment in metabolic pathways such as GABAergic synapse, neuroactive ligand-receptor interaction and nicotine addiction (Fig. 9F).

Consensus clustering analysis was performed to identify distinct subgroups of PD patients based on their gene expression profiles. (A, B). Consensus clustering analysis results indicating the CDF for different values of K (number of subgroups) in PD patients. The CDF plot suggests that K = 2 is the optimal number of subgroups. (C, D). Consensus clustering heatmap showing the correlation matrix when K = 2. (E). Enrichment analysis results for differentially expressed genes between the two PD subgroups. (F). KEGG analysis results for differentially expressed genes between the two PD subgroups.
Discussion
IBD and PD are distinct disorders affecting the gastrointestinal tract and nervous system, respectively. However, accumulating evidence suggests a potential link between them19. Epidemiological studies have reported an increased prevalence of PD among individuals with IBD, and conversely, an elevated incidence of IBD in patients with PD20,21. This shared association suggests the presence of shared biological mechanisms underlying both conditions. Immunological dysfunction has been proposed as a contributing factor to this association, given the critical role of the immune system in both IBD and PD22,23. The gut-brain axis, a bidirectional communication pathway between the gastrointestinal and nervous systems, may also play a role. Inflammatory processes within the gut can potentially influence the nervous system via this axis, increasing the risk of PD development. Research in this field has focused on analyzing gene expression profiles of IBD and PD patients to identify potential diagnostic markers. Using WGCNA and LASSO analysis, a 23-gene signature was constructed and validated using random forest and support vector machine models. Further analysis identified 5 key genes (BTK, NCF2, CRH, FCGR3A and SERPINA3) for nomogram and decision tree analysis. These genes were found to discriminate accurately between IBD and PD patients and healthy controls, with BTK and NCF2 expression levels being sufficient for accurate classification. Additionally, computational drug prediction using the CMap and PubChem databases identified potential small molecule therapeutics for both IBD and PD. RO-90-7501 and MST-312 were identified as promising candidates for further investigation.
BTK, the full name of Bruton’s tyrosine kinase, encoded by the BTK gene in humans, is a crucial enzyme in B cell development and signal transduction. It mediates signaling from the pre-B cell receptor formed after immunoglobulin heavy chain rearrangement. In PD, studies have reported a reduction in B lymphocytes24,25. Li et al. observed decreased B cell proliferation and alterations in B cell subsets, with a decrease in regulatory B cells and an increase in pro-inflammatory cytokine-producing B cells26. In α-synuclein transgenic mouse models of PD, Scott et al. demonstrated B cell depletion, suggesting a potential link to α-synuclein pathology27. Murine models have also shown that impaired meningeal drainage exacerbates PD pathology, possibly due to B cell migration to the cerebrospinal fluid or meninges. Depletion of B cells in the 6-OHDA mouse model of dopaminergic cell death worsens outcomes. B lymphocytes play a role in the gut-brain axis, as evidenced by their protective role in the brain during disseminated fungal infections in mice28. Notably, several existing drugs target B lymphocytes, with downstream effects on other immune cell types. Our research suggested that BTK expression levels can accurately discriminate PD patients from healthy controls, highlighting the potential for B cell-targeted therapies in PD. Further investigation is warranted to develop novel treatments targeting B cells for PD management.
Mutations in BTK lead to an inherited immunodeficiency disease called X-linked severe combined immunodeficiency (X-linked agammaglobulinemia, XLA). This disease is characterized by impaired B cell development, resulting in the inability to produce normal antibodies and increased susceptibility to infections29. Recent studies have revealed an association between BTK deficiency and IBD. Patients with XLA carrying loss-of-function mutations in the BTK gene exhibit a high prevalence of intestinal manifestations and IBD30. Animal studies have further demonstrated that BTK deficiency is a genetic risk factor for IBD, as BTK-deficient mice exhibit enhanced Th1 responses in the intestinal mucosa, rendering them more susceptible to colitis31. Beyond its role in B cell function, BTK also modulates innate immunity by regulating dendritic cell and macrophage function32. BTK exerts an inhibitory effect on the NLRP3 inflammasome, and low-dose ibrutinib treatment has been shown to upregulate NLRP3 inflammasome activation. BTK-deficient mice exhibit increased NLRP3 inflammasome activation, leading to enhanced pro-inflammatory responses in experimental models of colitis33. Our research suggested that BTK can serve as a biomarker for accurate identification of IBD. This finding provides novel insights for the diagnosis and management of IBD and related disorders involving intestinal immune dysregulation.
In addition to BTK, NCF2 also plays a significant role in both IBD and PD. NCF2 is involved in the production of reactive oxygen species (ROS) through the NADPH oxidase complex, which is crucial for the immune response34. Elevated ROS levels can contribute to tissue damage and inflammation in IBD, while oxidative stress is a known factor in neuronal degeneration in PD35,36. CRH, another key gene, is involved in the stress response and has pro-inflammatory effects in the gastrointestinal tract, contributing to IBD pathophysiology. It can increase intestinal permeability and promote inflammation through mast cell activation37. In PD, CRH and HPA axis dysregulation are implicated in non-motor symptoms such as anxiety and depression38. FCGR3A encodes the FcγRIIIa receptor, which plays a critical role in antibody-dependent cellular cytotoxicity39. Polymorphisms in FCGR3A are associated with various autoimmune diseases and may contribute to the inflammatory response in IBD by mediating immune cell activation and cytokine release. In PD, immune dysregulation and inflammation are increasingly recognized as contributing factors, and FCGR3A may be involved in these processes. Lastly, SERPINA3 encodes α1-antichymotrypsin, an acute-phase protein that inhibits various proteases. It is upregulated in response to inflammation and has been implicated in several inflammatory diseases, including IBD40. In our analysis, increased levels of SERPINA3 have been found in the brains of PD patients, suggesting a role in the neuroinflammatory processes associated with the disease.
One limitation of our study is the relatively small sample size, particularly for the PD dataset, which may affect the robustness of our findings. Future studies with larger cohorts are needed to validate our results. Additionally, our models were derived and validated on the same datasets, which may lead to overestimation of their performance. Independent validation using external datasets is necessary to confirm the generalizability of our models. Potential confounders such as active inflammation, existing drug therapy, and disease duration were not fully accounted for in our analysis. Active inflammation can significantly alter gene expression profiles, potentially confounding the identification of disease-specific biomarkers. Existing drug therapies may also influence gene expression and immune responses, thereby affecting the observed associations. Disease duration is another critical factor, as gene expression changes over the course of the disease. Future research should stratify patients based on these variables to provide a more nuanced understanding of the relationship between PD and IBD.
Despite these limitations, our study provides novel insights into the co-diagnosis and treatment of PD and IBD. Notably, our findings suggest that targeting BTK may be a promising therapeutic strategy for both diseases. Further research is warranted to explore the therapeutic potential of BTK inhibitors in clinical settings. Additionally, future studies should consider employing WGCNA on both PD and IBD datasets to uncover a more comprehensive understanding of the gene co-expression networks involved in both diseases.
Conclusions
In our study, we found that BTK may be useful in discriminating both IBD and PD. Since the B cell receptor signaling pathway is likely to play an important role in the pathogenesis of these diseases, targeting this pathway may have therapeutic implications. It should be noted that although the drug has shown promising efficacy in clinical trials, further studies are still needed to determine its precise role and efficacy in the treatment of IBD and PD.
Data availability
The raw data supporting the conclusions of this article will be made available by the authors, without undue reservation. Shou-Bin Ning should be contacted if someone wants to request the data from this study.
References
-
Weintraub, D. et al. Management of psychiatric and cognitive complications in Parkinson’s disease. BMJ 379, e068718. https://doi.org/10.1136/bmj-2021-068718 (2022).
-
Panicker, N., Ge, P., Dawson, V. L. & Dawson, T. M. The cell biology of Parkinson’s disease. J. Cell Biol. https://doi.org/10.1083/jcb.202012095 (2021).
-
Tolosa, E., Garrido, A., Scholz, S. W. & Poewe, W. Challenges in the diagnosis of Parkinson’s disease. The Lancet. Neurol. 20, 385–397. https://doi.org/10.1016/s1474-4422(21)00030-2 (2021).
-
Calabresi, P. et al. Alpha-synuclein in Parkinson’s disease and other synucleinopathies: From overt neurodegeneration back to early synaptic dysfunction. Cell Death Dis. 14, 176. https://doi.org/10.1038/s41419-023-05672-9 (2023).
-
Tan, A. H., Lim, S. Y. & Lang, A. E. The microbiome-gut-brain axis in Parkinson disease—From basic research to the clinic. Nat. Rev. Neurol. 18, 476–495. https://doi.org/10.1038/s41582-022-00681-2 (2022).
-
Cavallieri, F. et al. Long-term effects of bilateral subthalamic nucleus deep brain stimulation on gait disorders in Parkinson’s disease: A clinical-instrumental study. J. Neurol. 270, 4342–4353. https://doi.org/10.1007/s00415-023-11780-5 (2023).
-
Armstrong, M. J. & Okun, M. S. Diagnosis and treatment of Parkinson disease: A review. Jama 323, 548–560. https://doi.org/10.1001/jama.2019.22360 (2020).
-
Plevris, N. & Lees, C. W. Disease monitoring in inflammatory bowel disease: Evolving principles and possibilities. Gastroenterology 162, 1456-1475.e1451. https://doi.org/10.1053/j.gastro.2022.01.024 (2022).
-
Mak, W. Y., Zhao, M., Ng, S. C. & Burisch, J. The epidemiology of inflammatory bowel disease: East meets west. J. Gastroenterol. Hepatol. 35, 380–389. https://doi.org/10.1111/jgh.14872 (2020).
-
Jeong, D. Y. et al. Induction and maintenance treatment of inflammatory bowel disease: A comprehensive review. Autoimmun. Rev. 18, 439–454. https://doi.org/10.1016/j.autrev.2019.03.002 (2019).
-
Bischoff, S. C. et al. ESPEN guideline on clinical nutrition in inflammatory bowel disease. Clin. Nutr. (Edinb., Scotl.) 42, 352–379. https://doi.org/10.1016/j.clnu.2022.12.004 (2023).
-
Zhu, F. et al. The risk of Parkinson’s disease in inflammatory bowel disease: A systematic review and meta-analysis. Dig. Liver Dis. Off. J. Ital. Soc. Gastroenterol. Ital. Assoc. Study Liver 51, 38–42. https://doi.org/10.1016/j.dld.2018.09.017 (2019).
-
Li, Y. et al. Intestinal inflammation and Parkinson’s Disease. Aging Dis. 12, 2052–2068. https://doi.org/10.14336/ad.2021.0418 (2021).
-
Witoelar, A. et al. Genome-wide pleiotropy between Parkinson disease and autoimmune diseases. JAMA Neurol. 74, 780–792. https://doi.org/10.1001/jamaneurol.2017.0469 (2017).
-
Zeng, J., Wang, X., Pan, F. & Mao, Z. The relationship between Parkinson’s disease and gastrointestinal diseases. Front. Aging Neurosci. 14, 955919. https://doi.org/10.3389/fnagi.2022.955919 (2022).
-
Choi, K. et al. Depression in patients with inflammatory bowel disease is associated with increased risk of dementia and Parkinson’s disease: A nationwide, population-based study. Front. Med. 9, 1014290. https://doi.org/10.3389/fmed.2022.1014290 (2022).
-
Rolli-Derkinderen, M. et al. Is Parkinson’s disease a chronic low-grade inflammatory bowel disease?. J. Neurol. 267, 2207–2213. https://doi.org/10.1007/s00415-019-09321-0 (2020).
-
Lee, H. S., Lobbestael, E., Vermeire, S., Sabino, J. & Cleynen, I. Inflammatory bowel disease and Parkinson’s disease: Common pathophysiological links. Gut 70, 408–417. https://doi.org/10.1136/gutjnl-2020-322429 (2021).
-
Villumsen, M., Aznar, S., Pakkenberg, B., Jess, T. & Brudek, T. Inflammatory bowel disease increases the risk of Parkinson’s disease: a Danish nationwide cohort study 1977–2014. Gut 68, 18–24. https://doi.org/10.1136/gutjnl-2017-315666 (2019).
-
Camacho-Soto, A., Gross, A., Searles Nielsen, S., Dey, N. & Racette, B. A. Inflammatory bowel disease and risk of Parkinson’s disease in Medicare beneficiaries. Parkinsonism Relat. disord. 50, 23–28. https://doi.org/10.1016/j.parkreldis.2018.02.008 (2018).
-
Clairembault, T. et al. Structural alterations of the intestinal epithelial barrier in Parkinson’s disease. Acta Neuropathol. Commun. 3, 12. https://doi.org/10.1186/s40478-015-0196-0 (2015).
-
Gonzalez-Latapi, P. & Marras, C. Epidemiological evidence for an immune component of Parkinson’s disease. J. Parkinson’s Dis. 12, S29-s43. https://doi.org/10.3233/jpd-223180 (2022).
-
Saez, A., Herrero-Fernandez, B., Gomez-Bris, R., Sánchez-Martinez, H. & Gonzalez-Granado, J. M. Pathophysiology of inflammatory bowel disease: Innate immune system. Int. J. Mol. Sci. https://doi.org/10.3390/ijms24021526 (2023).
-
Stevens, C. H. et al. Reduced T helper and B lymphocytes in Parkinson’s disease. J. Neuroimmunol. 252, 95–99. https://doi.org/10.1016/j.jneuroim.2012.07.015 (2012).
-
Kedmi, M., Bar-Shira, A., Gurevich, T., Giladi, N. & Orr-Urtreger, A. Decreased expression of B cell related genes in leukocytes of women with Parkinson’s disease. Mol. Neurodegener. 6, 66. https://doi.org/10.1186/1750-1326-6-66 (2011).
-
Li, R. et al. Abnormal B-cell and Tfh-cell profiles in patients with Parkinson disease: A cross-sectional study. Neurol. Neuroimmunol. Neuroinflammation https://doi.org/10.1212/nxi.0000000000001125 (2022).
-
Scott, K. M. et al. B lymphocyte responses in Parkinson’s disease and their possible significance in disease progression. Brain communications 5, fcad60. https://doi.org/10.1093/braincomms/fcad060 (2023).
-
Fitzpatrick, Z. et al. Gut-educated IgA plasma cells defend the meningeal venous sinuses. Nature 587, 472–476. https://doi.org/10.1038/s41586-020-2886-4 (2020).
-
Altman, K. et al. Health-related quality of life in 91 patients with X-linked agammaglobulinemia. J. Clin. Immunol. 42, 811–818. https://doi.org/10.1007/s10875-022-01222-8 (2022).
-
Barmettler, S. et al. Gastrointestinal manifestations in X-linked agammaglobulinemia. J. Clin. Immunol. 37, 287–294. https://doi.org/10.1007/s10875-017-0374-x (2017).
-
Guan, D., Wang, Z., Huo, J., Xu, S. & Lam, K. P. Bruton’s tyrosine kinase regulates gut immune homeostasis through attenuating Th1 response. Cell Death Dis. 12, 431. https://doi.org/10.1038/s41419-021-03702-y (2021).
-
Weber, A. N. R. et al. Bruton’s tyrosine kinase: An emerging key player in innate immunity. Front. Immunol. 8, 1454. https://doi.org/10.3389/fimmu.2017.01454 (2017).
-
Mao, L. et al. Bruton tyrosine kinase deficiency augments NLRP3 inflammasome activation and causes IL-1β-mediated colitis. J. Clin. Investig. 130, 1793–1807. https://doi.org/10.1172/jci128322 (2020).
-
Paolillo, R. et al. The NADPH oxidase NOX2 is a marker of adverse prognosis involved in chemoresistance of acute myeloid leukemias. Haematologica 107, 2562–2575. https://doi.org/10.3324/haematol.2021.279889 (2022).
-
Denson, L. A. et al. Clinical and genomic correlates of neutrophil reactive oxygen species production in pediatric patients with Crohn’s disease. Gastroenterology 154, 2097–2110. https://doi.org/10.1053/j.gastro.2018.02.016 (2018).
-
Sophronea, T. et al. A(2A)R antagonists triggered the AMPK/m-TOR autophagic pathway to reverse the calcium-dependent cell damage in 6-OHDA induced model of PD. Neurochem. Int. https://doi.org/10.1016/j.neuint.2024.105793 (2024).
-
Vanuytsel, T. et al. Psychological stress and corticotropin-releasing hormone increase intestinal permeability in humans by a mast cell-dependent mechanism. Gut 63, 1293–1299. https://doi.org/10.1136/gutjnl-2013-305690 (2014).
-
Dos Santos, H. M. et al. Dementia and depression: Biological connections with amyloid β protein. Basic Clin. Pharmacol. Toxicol. 134, 563–573. https://doi.org/10.1111/bcpt.13996 (2024).
-
Kim, H. J. et al. Inebilizumab reduces neuromyelitis optica spectrum disorder risk independent of FCGR3A polymorphism. Ann. Clin. Transl. Neurol. 10, 2413–2420. https://doi.org/10.1002/acn3.51911 (2023).
-
Liu, F. et al. LAMB3 promotes intestinal inflammation through SERPINA3 and is directly transcriptionally regulated by P65 in inflammatory bowel disease. Inflamm. Bowel Dis. 30, 257–272. https://doi.org/10.1093/ibd/izad140 (2024).
Acknowledgments
All claims expressed in this article are solely those of the authors and do not necessarily represent those of their affiliated organizations, or those of the publisher, the editors and the reviewers. Any product that may be evaluated in this article, or claim that may be made by its manufacturer, is not guaranteed or endorsed by the publisher.
Author information
Authors and Affiliations
Contributions
Q.S.: Methodology, Software, Writing—original draft, Writing—review & editing, Data curation, Investigation. Y.L.: Methodology, Software, Visualization, Writing—original draft, Writing—review & editing. S.N.: Investigation, Project administration, Supervision, Writing—review & editing.
Corresponding author
Ethics declarations
Competing interests
The authors declare no competing interests.
Additional information
Publisher’s note
Springer Nature remains neutral with regard to jurisdictional claims in published maps and institutional affiliations.
Supplementary Information
Rights and permissions
Open Access This article is licensed under a Creative Commons Attribution-NonCommercial-NoDerivatives 4.0 International License, which permits any non-commercial use, sharing, distribution and reproduction in any medium or format, as long as you give appropriate credit to the original author(s) and the source, provide a link to the Creative Commons licence, and indicate if you modified the licensed material. You do not have permission under this licence to share adapted material derived from this article or parts of it. The images or other third party material in this article are included in the article’s Creative Commons licence, unless indicated otherwise in a credit line to the material. If material is not included in the article’s Creative Commons licence and your intended use is not permitted by statutory regulation or exceeds the permitted use, you will need to obtain permission directly from the copyright holder. To view a copy of this licence, visit http://creativecommons.org/licenses/by-nc-nd/4.0/.
About this article

Cite this article
Sun, Q., Li, YJ. & Ning, SB. Investigating the molecular mechanisms underlying the co-occurrence of Parkinson’s disease and inflammatory bowel disease through the integration of multiple datasets. Sci Rep 14, 17028 (2024). https://doi.org/10.1038/s41598-024-67890-1
-
Received:
-
Accepted:
-
Published:
-
DOI: https://doi.org/10.1038/s41598-024-67890-1
Keywords
Comments
By submitting a comment you agree to abide by our Terms and Community Guidelines. If you find something abusive or that does not comply with our terms or guidelines please flag it as inappropriate.
This news item came from: https://www.nature.com/articles/s41598-024-67890-1