Abstract
Dopaminergic neurons in the ventral tier of the substantia nigra pars compacta (SNc) degenerate prominently in Parkinson’s disease (PD), while those in the dorsal tier and ventral tegmental area are relatively spared. The factors determining why these neurons are more vulnerable than others are still unrevealed. Neuroinflammation and immune cell infiltration have been demonstrated to be a key feature of neurodegeneration in PD. However, the link between selective dopaminergic neuron vulnerability, glial and immune cell response, and vascularization and their interactions has not been deciphered. We aimed to investigate the contribution of glial cell activation and immune cell infiltration in the selective vulnerability of ventral dopaminergic neurons within the midbrain in a non-human primate model of PD. Structural characteristics of the vasculature within specific regions of the midbrain were also evaluated. Parkinsonian monkeys exhibited significant microglial and astroglial activation in the whole midbrain, but no major sub-regional differences were observed. Remarkably, the ventral substantia nigra was found to be typically more vascularized compared to other regions. This feature might play some role in making this region more susceptible to immune cell infiltration under pathological conditions, as greater infiltration of both T- and B- lymphocytes was observed in parkinsonian monkeys. Higher vascular density within the ventral region of the SNc may be a relevant factor for differential vulnerability of dopaminergic neurons in the midbrain. The increased infiltration of T- and B- cells in this region, alongside other molecules or toxins, may also contribute to the susceptibility of dopaminergic neurons in PD.
Introduction
The main neuropathological features of PD is the loss of dopaminergic neurons in the substantia nigra pars compacta (SNc)1. Cardinal motor features (akinesia, rigidity, and tremor) generally appear only after 40–60% of dopaminergic neurons are lost, and striatal dopamine (DA) concentration falls below 60–70%1,2. However, some dopaminergic midbrain neurons survive even into the late stages of the disease, suggesting differential vulnerability to degeneration. Specifically, dopaminergic neurons in the ventral SNc are highly vulnerable, while dopaminergic neurons in the dorsal SNc and ventral tegmental area (VTA) demonstrate a much lower degree of degeneration3,4,5,6. To date, the factors underlying differential vulnerability within this defined cytoarchitectural region are still unknown7.
Several factors might contribute to selective vulnerability of SNc DA neurons in PD, including oxidative stress, DA toxicity, iron content, autonomous pacemaking, axonal arborization size, lack of calcium-binding proteins such as calbindin-D28K, and gene factors4,7,8. One commonality between these factors is that they all suggest that vulnerable neurons are under intense bioenergetic demand9. Regulation of tissue energy supply and cellular energy metabolism is essential to maintain healthy cellular and systemic function10. Energy requirements are therefore not uniform throughout the brain but instead are increased in localized regions dependent on neuronal activity. Altered transport of molecules (including toxins) between blood and brain, aberrant angiogenesis, vessel regression, and inflammatory responses may contribute to the different neuronal vulnerability in PD11,12,13,14. The neuroinflammatory scenario of PD includes glial cell activation15, immune cell infiltration into the central nervous system (CNS)16,17, and increased pro-inflammatory cytokines/chemokines in the brain parenchyma18,19,20,21. Still, the link between SNc dopaminergic neuron vulnerability, glial and immune cell responses, vascular alterations, and how they contribute to neurodegeneration in PD remains unclear14.
Thus, we aimed to investigate the contribution of glial cell activation and immune cell infiltration in selective vulnerability of dopaminergic neurons, as well as to assess structural changes in the vascular system within specific midbrain regions in a well-established non-human primate model of PD.
Results
Differential degeneration of dopaminergic neurons in MPTP primates
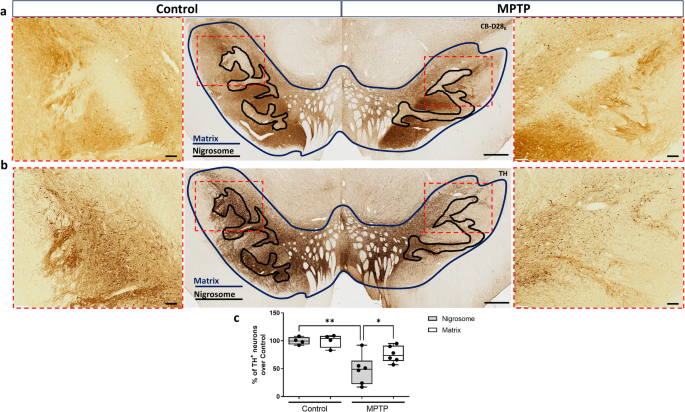
We first confirmed the higher vulnerability of the ventral dopaminergic neurons including the nigrosome by stereological analysis of TH+ neurons within the whole dopaminergic midbrain. Sections immunostained for calbindin were used as a template to subdivide the dopaminergic midbrain region in two regions: the nigrosome (CB-D28K-poor zone) and the matrix (CB-D28K rich-zone) as described previously22 (Fig. 1a). The outlined regions were then applied on adjacent serial sections immunostained with TH, and the numbers of dopaminergic cells within these two regions were quantified (Fig. 1b). Neuronal loss was higher within the nigrosome of MPTP monkeys, where more than 50% of dopaminergic neurons degenerated in comparison with control monkeys (Fig. 1c). In contrast, the neurons contained in the matrix of MPTP monkeys showed only a 24% loss compared with the control monkeys (Fig. 1c).
Calbindin immunostained sections were used as a template to subdivide the dopaminergic midbrain region in the nigrosome (CB-D28K-poor zone, outlined in black) and the matrix (CB-D28K-rich zone, outlined in blue) (a). Outlined regions were then applied on adjacent serial sections immunostained with TH (b). Box and whisker plots with median, percentiles, and individual values of 4 control and 6 MPTP monkeys display the number of dopaminergic cells within the nigrosome vs. the matrix (c). Neuronal loss was higher in the nigrosome than the matrix of MPTP monkeys compared to the same regions in control monkeys. Two-way ANOVA and multiple comparisons were applied to determine which pairs were significantly different. A confidence level of 95% was accepted as significant. *P < 0.05; **P < 0.01. Scale bar of low magnification images = 1 mm; Scale bar of high magnification images = 200 μm.
Glial response patterns in MPTP-induced neurodegeneration
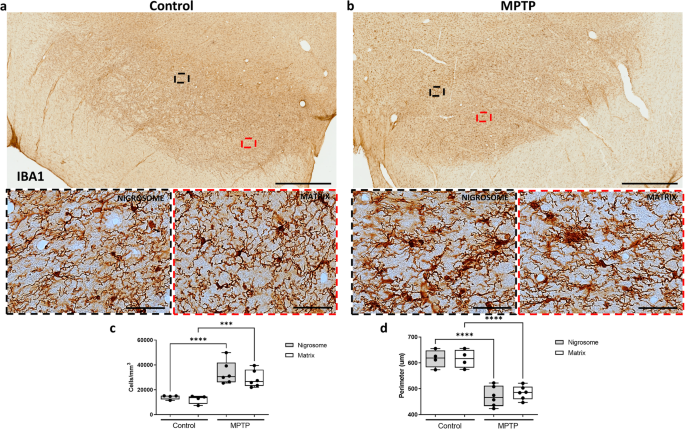
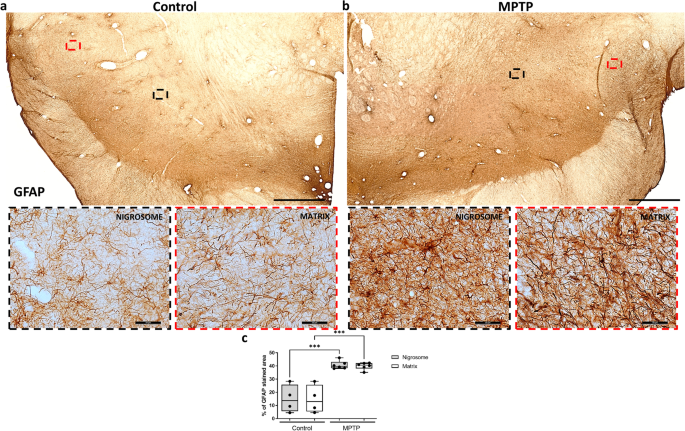
Then, the same CB-D28K-outlined regions were equally applied on adjacent serial sections immunostained for different markers in each monkey. We first assessed whether glial populations were differently distributed along these regions. No differences were observed in comparing microglial cell numbers (Fig. 2) and GFAP content (Fig. 3) between the nigrosome and matrix of control monkeys, suggesting that glial cells equally populate these regions. An increase in microglial cells (Fig. 2c; P < 0.001) and a decreased microglial perimeter (Fig. 2d; P < 0.001), reflecting microglial proliferation and activation, were observed both in the nigrosome and the matrix of MPTP monkeys. MPTP-treated monkeys displayed significantly more microglial cells with ameboid morphology (Fig. 2b) in comparison with the control group, presenting fewer cells and a predominant ramified and surveilling morphology (Fig. 2a). Similarly, more GFAP content, reflecting astrogliosis, was observed in both the nigrosome and the matrix of MPTP monkeys compared with the control group (Fig. 3; P < 0.001).
Low and high magnification representative images of two sections from a control (a) and an MPTP monkey (b) immunostained with IBA1 are shown. Box and whisker plots with median, percentiles, and individual values of 4 control and 6 MPTP monkeys display numerical (c) and morphological (d) values of microglial cells. MPTP monkeys show massive glial activation in the whole midbrain, but no major inter-regional differences were observed in comparing the nigrosome and matrix. Two-way ANOVA and multiple comparisons were applied to determine which pairs were significantly different. A confidence level of 95% was accepted as significant. ***P < 0.001; ****P < 0.0001. Scale bar of low magnification images = 1 mm; Scale bar of high magnification images = 50 μm.
Low and high magnification representative images of two sections from a control (a) and an MPTP monkey (b) immunostained with GFAP are shown. Box and whisker plots with median, percentiles, and individual values of 4 control and 6 MPTP monkeys display the percentage of GFAP stained area in groups and regions (c). MPTP monkeys show more GFAP content in the whole midbrain, but no major inter-regional differences were observed in comparing the nigrosome and matrix. Two-way ANOVA and multiple comparisons were applied to determine which pairs were significantly different. A confidence level of 95% was accepted as significant. ***P < 0.001. Scale bar of low magnification images = 1 mm; Scale bar of high magnification images = 50 μm.
Immune cell infiltration and vascular dynamics
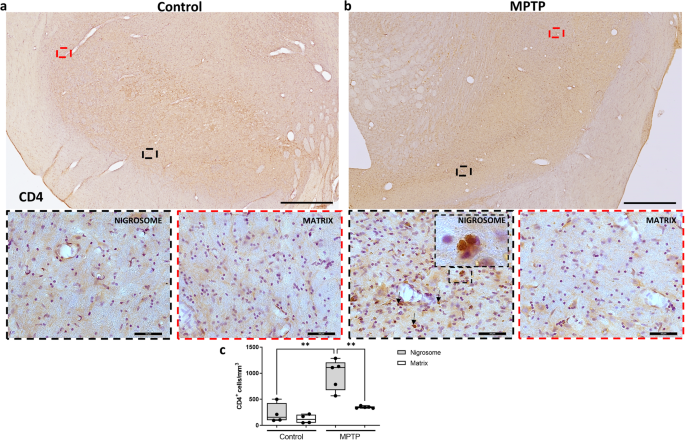
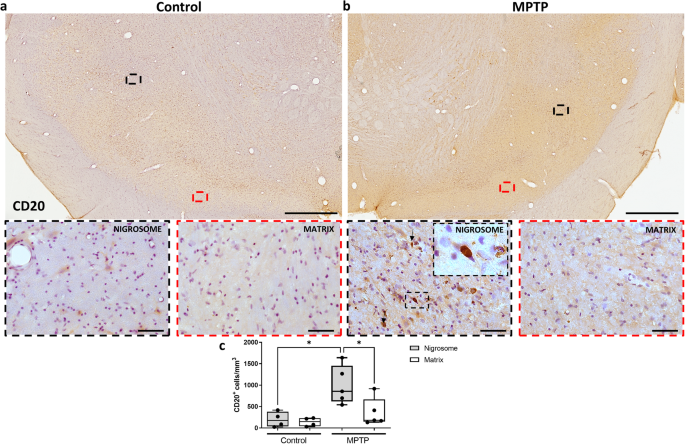
Several studies have revealed infiltration of T and B lymphocytes in the substantia nigra of PD patients and PD animal models16,23,24. We thus investigated whether this infiltration was region dependent. Stereological analysis of sections immunostained against CD4 (Fig. 4) and CD20 (Fig. 5), markers of T and B lymphocytes, respectively, revealed infiltration of both cell types within the nigrosome of MPTP monkeys (Fig. 4c; P < 0.01 and Fig. 5c; P < 0.05).
Low and high magnification representative images of two sections from a control (a) and an MPTP monkey (b) immunostained with CD4 are shown. Box and whisker plots with median, percentiles, and individual values of 4 control and 5 MPTP monkeys display the number of infiltrating T cells estimated by stereology (c). Increased T cell infiltration was observed in the nigrosome but not in the matrix of MPTP monkeys in comparison with control monkeys. Arrows and insets indicate some examples of infiltrated T cells in the analyzed brain regions. Two-way ANOVA and multiple comparisons were performed to determine which pairs were significantly different. A confidence level of 95% was accepted as significant. **P < 0.01. Scale bar of low magnification images = 1 mm; Scale bar of high magnification images = 50 μm.
Low and high magnification representative images of two sections from a control (a) and an MPTP monkey (b) immunostained with CD20 are shown. Box and whisker plots with median, percentiles, and individual values of 4 control and 5 MPTP monkeys display the number of infiltrating B cells estimated by stereology (c). Increased B cell infiltration was observed in the nigrosome but not in the matrix of MPTP monkeys in comparison with control monkeys. Arrows and insets indicate some examples of infiltrated B cells in the analyzed brain regions. Two-way ANOVA and multiple comparisons were performed to determine which pairs were significantly different. A confidence level of 95% was accepted as significant. *P < 0.05. Scale bar of low magnification images = 1 mm; Scale bar of high magnification images = 50 μm.
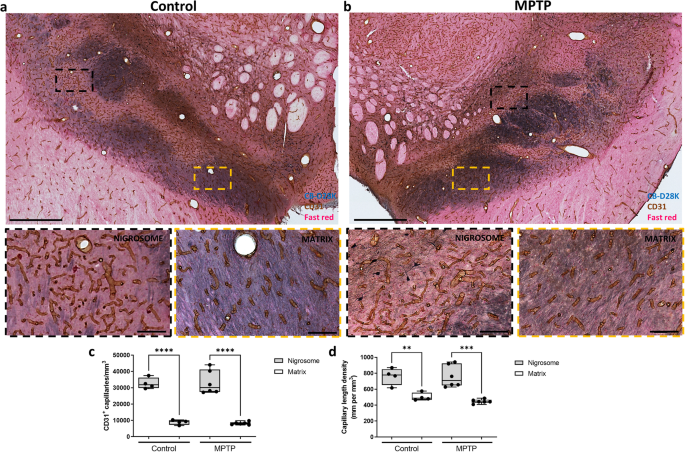
Previous reports have suggested that structural variations in the vasculature traversing different anatomical regions within the CNS strongly influence where and how CNS immune responses first develop25. Thus, we analyzed vascular distribution to investigate how immune cells selectively infiltrate the different dopaminergic midbrain regions. Using the endothelial cell marker CD31 we performed a stereological estimation of density (number of capillaries/mm3) and length density (mm of capillaries/mm3) of capillaries within the nigrosome and the matrix (Fig. 6). Remarkably, the nigrosome region was more vascularized in control monkeys in comparison with the rest of the dopaminergic midbrain regions (Fig. 6a). Control monkeys showed more capillaries (Fig. 6c; P < 0.0001) that were more densely packed (Fig. 6d; P < 0.01) within the nigrosome compared to the matrix. MPTP treatment did not alter vascular the distribution (Fig. 6b).
Low and high magnification representative images of two sections double-immunostained with CB-D28K (in blue) and CD31 (in brown) (a, b). Box and whisker plots with median, percentiles, and individual values of 4 control and 6 MPTP monkeys display the density (c) and length density (d) of capillaries in the nigrosome and matrix quantified by stereology. In control and parkinsonian monkeys, the nigrosome (blue-poor regions) is much more vascularized in comparison with the rest of the dopaminergic midbrain (blue-enriched regions). Two-way ANOVA and multiple comparisons were performed to determine which pairs were significantly different. A confidence level of 95% was accepted as significant. **P < 0.01; ***P < 0.001; ****P < 0.0001. Scale bar of low magnification images = 1 mm; Scale bar of high magnification images = 100 μm.
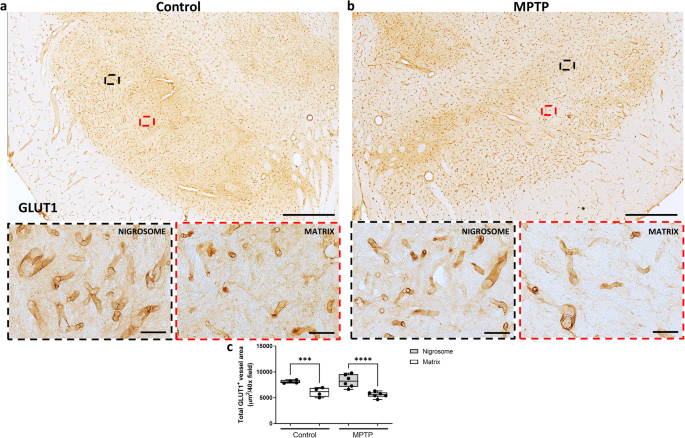
To further confirm these findings, we analyzed the vascular distribution using another vascular marker (GLUT1) and an alternative quantitative method (automated quantification). Automated analysis of GLUT1 immunostained sections confirmed the previous results, showing more capillaries in the nigrosome than in the matrix of both groups (Fig. 7c; P < 0.0001). No major difference was found in a comparison of control vs MPTP monkeys (Fig. 7a, b).
Low and high magnification representative images of two sections from a control (a) and an MPTP monkey (b) immunostained with GLUT1 are shown. Box and whisker plots with median, percentiles, and individual values of 4 control and 6 MPTP monkeys display the total GLUT1+ vessel area per field by automated quantification by ImageJ (c), being higher in the nigrosome than in the rest of the dopaminergic midbrain. Two-way ANOVA and multiple comparisons were performed to determine which pairs were significantly different. A confidence level of 95% was accepted as significant. ***P < 0.001; ****P < 0.0001. Scale bar of low magnification images = 1 mm; Scale bar of high magnification images = 50 μm.
Discussion
We show here that the ventral tier of the SNc, the nigrosome, is normally more densely vascularized than the rest of the midbrain. This unique feature could make this region particularly sensitive to stressors of any sort and also be a privileged route of entry for toxins and immune cells contributing to PD pathology and vulnerability of the ventral SNc. Surprisingly, the role of increased vascularization of the substantia nigra as a possible contributor to selective vulnerability has only been taken into consideration in isolated studies in monkeys26,27 and PD patients28. The fact that the nigrosome is highly vascularized is not totally unexpected and builds on the distinct features of the SNc ventral region. In fact, the data presented here, together with other studies in non-human primates and human post-mortem brain samples, indicate that the nigrosome is significantly more densely cell populated compared to the rest of the midbrain3,22,29,30,31. Moreover, the ventral SNc is known to be a zone of high energy demand, making it particularly bioenergetically compromised in the human brain32,33,34,35. Thus, the greater vascularization within the nigrosome may be a normal feature in accordance with its metabolism but could allow the entrance into the brain parenchyma of deleterious factors.
Indeed, we observed preferential entrance of lymphocytes into the nigrosome. We can speculate that the greater vascularization in this region may have acted as a privileged route of entry for these cells. Admittedly, our neurotoxic model and approach does not allow further elucidation of a possible specific pathogenic role of lymphocytes. To what extent this distinctive infiltration could play a role in the different vulnerability of midbrain neurons or is just a consequence of the higher dopaminergic cell death needs to be more definitively addressed. Nevertheless, a consistent body of literature suggests a pivotal role of infiltrating immune cells within the SNc in the neurodegenerative process of PD36. McGeer and colleagues described a substantial presence of CD8 + T cells in the post-mortem brain in a PD patient23. Stronger quantitative evidence from a larger number of subjects revealed infiltration of CD4+ and CD8 + T cells specifically in the substantia nigra of 14 PD patients16. More recently, it has been suggested that immune cell invasion into the substantia nigra may even precede the dopaminergic neuronal loss in this region17. Also, mice overexpressing α -synuclein in the midbrain developed upregulation of the major histocompatibility complex II (MHCII) protein on microglia, macrophages, and monocytes, accompanied by infiltration of CD4 and CD8 T cells into the SNc37. More evidence along this line was obtained in several neurotoxin models of PD induced by MPTP38,39 and 6-hydroxydopamine40. Certainly, reducing the activation or entrance of T-cells with immunosuppressive drugs or reducing the deleterious effects of peripheral immune activity led to reduced deposits of pathogenic forms of α-synuclein, low-grade neuroinflammation, and reduced neurodegeneration37,41,42,43,44,45.
While T cells have been extensively studied in the brains of post-mortem PD patients and animal models, research into the role of B cells to date has been limited. In steady-state conditions, B cells enter all areas of brain parenchyma in low numbers46. However, B cells can increase in number and/or effector function under pathological situations (including aging and neurodegenerative diseases)47. A possible role of humoral immunity (B cells) in the pathogenesis of PD was first described in a postmortem study with idiopathic and genetic PD. This study found the presence of immunoglobulin G (IgG) binding to dopaminergic neurons and Lewy bodies in the substantia nigra, highlighting a role for antibody-dependent B cell-mediated cytotoxicity in PD48. These results were later supported by investigations in PD animal models, unveiling long-term infiltration of B cells in the midbrain of rodents49,50,51 and non-human primates52. Yet, further studies to identify the underlying mechanisms mediating this infiltration, considering different sub-regions, and the role of the blood-brain barrier in this scenario are needed.
Finally, we have also investigated the role of glial cells in the selective vulnerability of dopaminergic neurons. Microglia and astrocytes were equally distributed in the entire midbrain in normal monkeys. This result agrees with a previous report that showed no sub-regional differences in glial cell activation state or number in the midbrain of normal young or adult rhesus macaques53. As expected, MPTP monkeys displayed increased astrogliosis and microglial proliferation and activation in the entire dopaminergic midbrain, but no sub-regional differences were observed. However, it has been well established that microglia and astrocytes, as part of the neurovascular unit, can exert destructive or reparative functions, responding differently depending upon local extracellular and intracellular signals54,55,56,57. Thus, it is possible that the greater vascularization and immune response found in the nigrosome, together with other factors already known (neurotoxins or α-synuclein among others), could synergistically promote a pro-inflammatory phenotype and contribute to the neurodegenerative processes in PD.
The results presented here suggest a possible role of vascular elements in the vulnerability of dopaminergic neurons within the substantia nigra in PD. The hyper-vascularization of the nigrosome may serve as a privileged mechanism and route of entry for toxins, immune cells, and other substances under pathological situations. The observed inflammation and infiltration of immune cells are probable outcomes of the loss of dopaminergic cells in this monkey model. Nevertheless, our findings mark the first instance of proposing how specific mechanisms, such as neuroinflammation and immune cell infiltration, may exert a disproportionate influence on this region, likely attributable to its distinctive vascular cytoarchitecture.
Methods
Animals and MPTP administration
Ten male macaque monkeys (Macaca fascicularis), weighing 5.5–12 kg, aged 5–10 years, and sourced from R.C. Hartelust BV (Tilburg, The Netherlands), were used in this study. The animals were housed in an animal room under standard conditions and treated in accordance with European and Spanish guidelines (86/609/EEC and 2003/65/EC European Council Directives and the Spanish Government). The experimental protocol was approved by the Ethical Committee for Research of the Fundación de Investigación HM Hospitales and of Comunidad de Madrid. Water and fresh fruit were available ad libitum. Qualified health care personnel oversaw the monkeys’ welfare throughout the studies.
Six monkeys were treated with 1-methyl-4-phenyl-1,2,3,6-tetrahydropyridine (MPTP, Sigma) by systemic administration (i.v.) under light anesthesia (ketamine 10 mg/kg; i.m.) using a dose regimen of 0.5 mg/kg every 2 weeks to obtain partial, slowly progressive degeneration of the nigrostriatal dopaminergic system as described before29,58,59,60,61,62. As each animal has a different susceptibility to MPTP, the number of injections varied depending on the systemic response to the toxin and the motor score reached. Motor status was assessed using the validated Kurlan motor scale63. Four animals showed evident parkinsonism after either the first or the second MPTP injections, whereas another two animals showed no apparent parkinsonian features after 3 MPTP injections and did not receive any further doses. The mean motor scale scores in all MPTP monkeys were 10.5 ± 3.5 (after MPTP injections) and 6.5 ± 4.1 (before sacrifice). Four monkeys were used as controls. No animals received l-DOPA or dopaminergic agonizts during the study. Animals were sacrificed from 2 to 14 weeks after the last MPTP injections. In this study, all MPTP monkeys exhibited minimal group variations across all analyzed parameters (inflammatory, immune, and vascular parameters). Additionally, no significant correlation between these parameters and motor scale was observed (data not shown). Therefore, we grouped all MPTP monkeys to increase the statistical power of each analysis.
Fixation and tissue processing
Monkeys were anesthetized deeply with sodium pentobarbital (10 mg/kg/i.p.) and perfused through the ascending aorta with saline, followed by 4% paraformaldehyde in phosphate buffer (PB) and a series of PB sucrose solutions (5–10–20%). After perfusion, brains were stereotaxically blocked in the coronal plane and sectioned on a sliding microtome at 40 μm to produce 10 matched series.
Immunohistochemistry
Sections were washed with Tris buffer (TB) and treated with citrate buffer (pH 6) for 30 min at 37 °C for antigen retrieval. Inhibition of endogenous peroxidase activity was performed using a mixture of 10% methanol and 3% concentrated H2O2 for 20 min. Normal serum was applied for 3 h to block non-specific binding sites. Sections were immunostained at 4 °C for a duration of 72 h using primary antibodies. Sections were washed with Tris-buffered saline (TBS) and transferred for 2 h to a solution containing the corresponding secondary biotinylated antibody. Next, sections were incubated for 45 min with the avidin-biotin-peroxidase complex (ABC Vectastain, Vector Laboratories). Immunohistochemical reactions were visualized by incubating the sections with 0.05% 3.3′-diaminobenzidine (DAB; Sigma) and 0.003% H202.
For double-labeling immunohistochemistry, after DAB staining, sections were washed with TBS at 95 °C for 5 min, and the immunohistochemical procedure was repeated using the next primary and secondary antibodies. Immunohistochemical reactions were visualized by incubating the sections with a blue chromogen (Vector peroxidase substrate kit, Vector Laboratories). Sections were then counterstained with hematoxylin or nuclear fast red for 5 min, dehydrated through ascending series of ethanol and cleared in 2 changes of xylene before being mounted in DPX and applying glass coverslips. The omission of the primary antibody resulted in non-staining (images not shown). All cases (animals) for each individual stain were batch processed under identical parameters.
A complete list of antibodies and reagents, together with incubation concentrations and commercial sources is provided in Table 1.
Regional segmentation of midbrain by CB-D28K immunostaining and immunohistochemical analysis
The dopaminergic subgroup boundaries in monkeys and humans are routinely distinguished according to immunoreactivity for TH immunoreactivity and calbindin (calcium-binding protein D28k, CB-D28K) (Fig. 1). The ventral tier of the SNc (nigrosome) is uniquely identified by its marked absence of CB-D28K immunoreactivity, in both the neuropil and soma of dopaminergic neurons3,6,22,30,64,65,66,67,68,69,70,71. We then grouped the CB-D28K-rich zones including the dorsal tier of the SNc, VTA, and the substantia nigra reticulata (SNr) as the matrix22 (Fig. 1).
The resulting ROIs were then applied on adjacent serial sections immunostained with the other markers to evaluate the role of neuroinflammation, immune cell infiltration, and vasculature in the selective vulnerability of dopaminergic neurons within the different regions.
Stereological analysis
Stereological estimation was carried out by using a computer-assisted image analysis system consisting of a microscope (Olympus BX3) equipped with a computer-controlled motorized stage, a camera, and the Stereo Investigator software (Stereo Investigator 2017, MicroBrightField). Four sections regularly spaced at intervals of 1200 μm with the optical fractionator method covering the entire rostro-caudal axis of the SNc were used. All parameters (counting objective, counting frame, and sampling grid) used for the stereological analysis are summarized in Table 2. After the counting was finished, the total number of cells or capillaries was automatically calculated by the software using the formula described by West72, and results were expressed as cells or capillaries per mm3.
Capillary length density was also quantified by using the Spaceballs probe as in Wälchli et al.73. For this analysis four sections regularly spaced at intervals of 1200 μm were used, and spheres with a radius of 20 μm in a sampling grid of 350 × 350 μm were applied (Table 2). All parameters were set to reach error coefficients below 0.10 (Gundersen, m = 1) as in Gundersen et al.74. Error coefficients of the estimates were calculated for each marker.
Immunohistochemical quantification of glial cell activation
Four sections per animal, regularly spaced at intervals of 1200 μm were used. All images were photographically recorded under the optical microscope (Olympus BX3). For the analysis of microglial activation, 20 40x-fields per section were used and the perimeter of microglial cells was quantified as in75 using the image analysis software (Image-Pro Plus 6.0.0.26, Media Cybernetics, Inc. Rockville). Briefly, all images were first converted from pixel to micrometers using the microscope calibration scale bar. Then, applying an intensity threshold (histogram-based manual intensity range selection) and size filter (area filter range), only microglial cells were selected. In our case, the intensity threshold was 0–180, and the size filter was 150-infinity μm2. The average perimeter of all microglia in the selected area was measured, and the results were expressed in micrometers, being lower in the ameboid activated microglia.
The analysis of astrocyte activation was performed using ImageJ 1.52a software. Twenty 40x-fields per section were used. The GFAP+ cells were selected by using the Phansalkar method from the Auto Local Threshold function, and no filter size was applied. Results were expressed as the percentage of GFAP covered area, being higher in case of astrogliosis.
Automated quantification of vascular area
Four sections per animal, regularly spaced at intervals of 1200 μm, were used. Automated analysis of the vascular area within the midbrain was performed on GLUT1 stained sections. All the images (20 40x-fields per sections) were photographically recorded under the optical microscope (Olympus BX3) and quantified with ImageJ 1.52a software. First, all images were converted from pixel to micrometers using the microscope calibration scale bar. A split channel function was used, and green channel images were selected. Then, applying an intensity threshold (“default” method from “auto threshold” function) and size filter (10000-infinity pixels), only capillaries were selected. The total vessel area was measured, and results were expressed in μm2/40x field.
Statistical analysis
All statistical analyses were performed using GraphPad Prism software. For all immunohistochemistry experiments, two-way ANOVA and multiple comparisons were performed to determine which pairs were significantly different. Statistical significance was defined as P < 0.05. An asterisk “*” indicates a significant difference between two regions of the same experimental group or between the same regions of two different experimental groups. All results were graphically presented using box and whisker plots depicting the median, percentiles, and individual values.
Data availability
The datasets generated during the current study are available in the Zenodo repository (https://zenodo.org/records/10977929).
References
-
Dauer, W. & Przedborski, S. Parkinson’s disease: mechanisms and models. Neuron 39, 889–909 (2003).
-
Blesa, J., Foffani, G., Dehay, B., Bezard, E. & Obeso, J. A. Motor and non-motor circuit disturbances in early Parkinson disease: which happens first? Nat. Rev. Neurosci. 23, 115–128 (2022).
-
Damier, P., Hirsch, E. C., Agid, Y. & Graybiel, A. M. The substantia nigra of the human brain. II. Patterns of loss of dopamine-containing neurons in Parkinson’s disease. Brain 122, 1437–1448 (1999).
-
Giguère, N., Burke Nanni, S. & Trudeau, L.-E. On cell loss and selective vulnerability of neuronal populations in Parkinson’s disease. Front Neurol. 9, 455 (2018).
-
Kordower, J. H. et al. Disease duration and the integrity of the nigrostriatal system in Parkinson’s disease. Brain 136, 2419–2431 (2013).
-
Yamada, T., McGeer, P. L., Baimbridge, K. G. & McGeer, E. G. Relative sparing in Parkinson’s disease of substantia nigra dopamine neurons containing calbindin-D28K. Brain Res. 526, 303–307 (1990).
-
Blesa, J., Lanciego, J. L. & Obeso, J. A. Editorial: Parkinson’s disease: cell vulnerability and disease progression. Front. Neuroanat. 9, 125 (2015).
-
Gonzalez-Rodriguez, P., Zampese, E. & Surmeier, D. J. Selective neuronal vulnerability in Parkinson’s disease. Prog. Brain Res. 252, 61–89 (2020).
-
Surmeier, D. J. & Schumacker, P. T. Calcium, bioenergetics, and neuronal vulnerability in Parkinson’s disease. J. Biol. Chem. 288, 10736–10741 (2013).
-
Watts, M. E., Pocock, R. & Claudianos, C. Brain energy and oxygen metabolism: emerging role in normal function and disease. Front. Mol. Neurosci. 11, 216 (2018).
-
Tambasco, N., Romoli, M. & Calabresi, P. Selective basal ganglia vulnerability to energy deprivation: experimental and clinical evidences. Prog. Neurobiol. 169, 55–75 (2018).
-
Zlokovic, B. V. The blood-brain barrier in health and chronic neurodegenerative disorders. Neuron 57, 178–201 (2008).
-
Balzano, T., Esteban-García, N. & Blesa, J. Neuroinflammation, immune response and α-synuclein pathology: how animal models are helping us to connect dots. Expert Opin. Drug Discov. 18, 13–23 (2023).
-
Tansey, M. G. et al. Inflammation and immune dysfunction in Parkinson disease. Nat. Rev. Immunol. https://doi.org/10.1038/s41577-022-00684-6 (2022).
-
Hirsch, E. C., Hunot, S., Damier, P. & Faucheux, B. Glial cells and inflammation in Parkinson’s disease: a role in neurodegeneration? Ann. Neurol. 44, S115–S120 (1998).
-
Brochard, V. et al. Infiltration of CD4+ lymphocytes into the brain contributes to neurodegeneration in a mouse model of Parkinson disease. J. Clin. Invest. 119, 182–192 (2009).
-
Galiano-Landeira, J., Torra, A., Vila, M. & Bové, J. CD8 T cell nigral infiltration precedes synucleinopathy in early stages of Parkinson’s disease. Brain 143, 3717–3733 (2020).
-
Brodacki, B. et al. Serum interleukin (IL-2, IL-10, IL-6, IL-4), TNFalpha, and INFgamma concentrations are elevated in patients with atypical and idiopathic parkinsonism. Neurosci. Lett. 441, 158–162 (2008).
-
Mogi, M. et al. Tumor necrosis factor-alpha (TNF-alpha) increases both in the brain and in the cerebrospinal fluid from parkinsonian patients. Neurosci. Lett. 165, 208–210 (1994).
-
Mogi, M. et al. Transforming growth factor-beta 1 levels are elevated in the striatum and in ventricular cerebrospinal fluid in Parkinson’s disease. Neurosci. Lett. 193, 129–132 (1995).
-
Mogi, M. et al. Interleukin (IL)-1 beta, IL-2, IL-4, IL-6 and transforming growth factor-alpha levels are elevated in ventricular cerebrospinal fluid in juvenile parkinsonism and Parkinson’s disease. Neurosci. Lett. 211, 13–16 (1996).
-
Damier, P., Hirsch, E. C., Agid, Y. & Graybiel, A. M. The substantia nigra of the human brain. I. Nigrosomes and the nigral matrix, a compartmental organization based on calbindin D(28K) immunohistochemistry. Brain 122, 1421–1436 (1999).
-
McGeer, P. L., Itagaki, S., Akiyama, H. & McGeer, E. G. Rate of cell death in parkinsonism indicates active neuropathological process. Ann. Neurol. 24, 574–576 (1988).
-
Tan, E.-K. et al. Parkinson disease and the immune system — associations, mechanisms and therapeutics. Nat. Rev. Neurol. 16, 303–318 (2020).
-
Mastorakos, P. & McGavern, D. The anatomy and immunology of vasculature in the central nervous system. Sci. Immunol. 4, eaav0492 (2019).
-
Barcia, C. et al. Changes in vascularization in substantia nigra pars compacta of monkeys rendered parkinsonian. J. Neural Transm. 112, 1237–1248 (2005).
-
Finley, K. H. Angio-architecture of the substantia nigra and its pathogenic significance. Arch. Neurol. Psychiatry 36, 118–127 (1936).
-
Issidorides, M. R. Neuronal vascular relationships in the zona compacta of normal and parkinsonian substantia nigra. Brain Res. 25, 289–299 (1971).
-
Blesa, J. et al. The nigrostriatal system in the presymptomatic and symptomatic stages in the MPTP monkey model: a PET, histological and biochemical study. Neurobiol. Dis. 48, 79–91 (2012).
-
Kelly, E. A., Contreras, J., Duan, A., Vassell, R. & Fudge, J. L. Unbiased stereological estimates of dopaminergic and GABAergic neurons in the A10, A9, and A8 subregions in the young male macaque. Neuroscience 496, 152–164 (2022).
-
Masilamoni, G. J. & Smith, Y. Chronic MPTP administration regimen in monkeys: a model of dopaminergic and non-dopaminergic cell loss in Parkinson’s disease. J. Neural Transm. 125, 337–363 (2018).
-
Gonzalez-Rodriguez, P., Zampese, E. & Surmeier, D. J. Disease mechanisms as subtypes: mitochondrial and bioenergetic dysfunction. Handb. Clin. Neurol. 193, 53–66 (2023).
-
Graves, S. M. et al. Dopamine metabolism by a monoamine oxidase mitochondrial shuttle activates the electron transport chain. Nat. Neurosci. 23, 15–20 (2020).
-
Surmeier, D. J. Determinants of dopaminergic neuron loss in Parkinson’s disease. FEBS J. 285, 3657–3668 (2018).
-
Zampese, E. et al. Ca2+ channels couple spiking to mitochondrial metabolism in substantia nigra dopaminergic neurons. Sci. Adv. 8, eabp8701 (2022).
-
Xu, Y. et al. The reciprocal interactions between microglia and T cells in Parkinson’s disease: a double-edged sword. J. Neuroinflammation 20, 33 (2023).
-
Williams, G. P. et al. CD4 T cells mediate brain inflammation and neurodegeneration in a mouse model of Parkinson’s disease. Brain 144, 2047–2059 (2021).
-
Reynolds, A. D. et al. Regulatory T cells attenuate Th17 cell-mediated nigrostriatal dopaminergic neurodegeneration in a model of Parkinson’s disease. J. Immunol. 184, 2261–2271 (2010).
-
Seo, J. et al. Chronic infiltration of T lymphocytes into the brain in a non-human primate model of Parkinson’s disease. Neuroscience 431, 73–85 (2020).
-
Theodore, S. & Maragos, W. 6-Hydroxydopamine as a tool to understand adaptive immune system-induced dopamine neurodegeneration in Parkinson’s disease. Immunopharmacol. Immunotoxicol. 37, 393–399 (2015).
-
Mosley, R. L. et al. A synthetic agonist to vasoactive intestinal peptide receptor-2 induces regulatory T cell neuroprotective activities in models of Parkinson’s dsease. Front. Cell. Neurosci. 13, 421 (2019).
-
Olson, K. E. et al. Granulocyte-macrophage colony-stimulating factor mRNA and Neuroprotective Immunity in Parkinson’s disease. Biomaterials 272, 120786 (2021).
-
Rockenstein, E. et al. Combined active humoral and cellular immunization approaches for the treatment of synucleinopathies. J. Neurosci. 38, 1000–1014 (2018).
-
Van der Perren, A. et al. FK506 reduces neuroinflammation and dopaminergic neurodegeneration in an α-synuclein-based rat model for Parkinson’s disease. Neurobiol. Aging 36, 1559–1568 (2015).
-
Villadiego, J. et al. Immunization with α-synuclein/Grp94 reshapes peripheral immunity and suppresses microgliosis in a chronic Parkinsonism model. Glia 66, 191–205 (2018).
-
Anthony, I. C., Crawford, D. H. & Bell, J. E. B lymphocytes in the normal brain: contrasts with HIV-associated lymphoid infiltrates and lymphomas. Brain 126, 1058–1067 (2003).
-
Sabatino, J. J., Pröbstel, A.-K. & Zamvil, S. S. B cells in autoimmune and neurodegenerative central nervous system diseases. Nat. Rev. Neurosci. 20, 728–745 (2019).
-
Orr, C. F., Rowe, D. B., Mizuno, Y., Mori, H. & Halliday, G. M. A possible role for humoral immunity in the pathogenesis of Parkinson’s disease. Brain 128, 2665–2674 (2005).
-
Campolo, M. et al. TLR7/8 in the pathogenesis of Parkinson’s disease. Int. J. Mol. Sci. 21, 9384 (2020).
-
Sanchez-Guajardo, V., Annibali, A., Jensen, P. H. & Romero-Ramos, M. α-Synuclein vaccination prevents the accumulation of parkinson disease-like pathologic inclusions in striatum in association with regulatory T cell recruitment in a rat model. J. Neuropathol. Exp. Neurol. 72, 624–645 (2013).
-
Theodore, S., Cao, S., McLean, P. J. & Standaert, D. G. Targeted overexpression of human alpha-synuclein triggers microglial activation and an adaptive immune response in a mouse model of Parkinson disease. J. Neuropathol. Exp. Neurol. 67, 1149–1158 (2008).
-
Barkholt, P., Sanchez-Guajardo, V., Kirik, D. & Romero-Ramos, M. Long-term polarization of microglia upon α-synuclein overexpression in nonhuman primates. Neuroscience 208, 85–96 (2012).
-
Kanaan, N. M., Kordower, J. H. & Collier, T. J. Age-related changes in glial cells of dopamine midbrain subregions in rhesus monkeys. Neurobiol. Aging 31, 937–952 (2010).
-
Hu, X. et al. Microglial and macrophage polarization—new prospects for brain repair. Nat. Rev. Neurol. 11, 56–64 (2015).
-
Jha, M. K., Lee, W.-H. & Suk, K. Functional polarization of neuroglia: Implications in neuroinflammation and neurological disorders. Biochem. Pharmacol. 103, 1–16 (2016).
-
Liu, L.-R., Liu, J.-C., Bao, J.-S., Bai, Q.-Q. & Wang, G.-Q. Interaction of microglia and astrocytes in the neurovascular unit. Front. Immunol. 11, 1024 (2020).
-
de Ceglia, R. et al. Specialized astrocytes mediate glutamatergic gliotransmission in the CNS. Nature 622, 120–129 (2023).
-
Blesa, J. et al. Progression of dopaminergic depletion in a model of MPTP-induced Parkinsonism in non-human primates. An (18)F-DOPA and (11)C-DTBZ PET study. Neurobiol. Dis. 38, 456–463 (2010).
-
Del Rey, N. L.-G., Trigo-Damas, I., Obeso, J. A., Cavada, C. & Blesa, J. Neuron types in the primate striatum: Stereological analysis of projection neurons and interneurons in control and parkinsonian monkeys. Neuropathol. Appl. Neurobiol. 48, e12812 (2022).
-
Jiménez-Sánchez, L. et al. Serotonergic innervation of the striatum in a nonhuman primate model of Parkinson’s disease. Neuropharmacology 170, 107806 (2020).
-
Molinet-Dronda, F. et al. Cerebral metabolic pattern associated with progressive parkinsonism in non-human primates reveals early cortical hypometabolism. Neurobiol. Dis. 167, 105669 (2022).
-
Monje, M. H. G., Blesa, J., García-Cabezas, M. Á., Obeso, J. A. & Cavada, C. Changes in thalamic dopamine innervation in a progressive Parkinson’s disease model in monkeys. Mov. Disord. 35, 419–430 (2020).
-
Kurlan, R., Kim, M. H. & Gash, D. M. The time course and magnitude of spontaneous recovery of parkinsonism produced by intracarotid administration of 1-methyl-4-phenyl-1,2,3,6-tetrahydropyridine to monkeys. Ann. Neurol. 29, 677–679 (1991).
-
Blazejewska, A. I. et al. Visualization of nigrosome 1 and its loss in PD: pathoanatomical correlation and in vivo 7 T MRI. Neurology 81, 534–540 (2013).
-
Blesa, J. & Vila, M. Parkinson disease, substantia nigra vulnerability, and calbindin expression: enlightening the darkness? Mov. Disord. 34, 161–163 (2019).
-
Dopeso-Reyes, I. G. et al. Calbindin content and differential vulnerability of midbrain efferent dopaminergic neurons in macaques. Front. Neuroanat. 8, 146 (2014).
-
Gaspar, P., Ben Jelloun, N. & Febvret, A. Sparing of the dopaminergic neurons containing calbindin-D28k and of the dopaminergic mesocortical projections in weaver mutant mice. Neuroscience 61, 293–305 (1994).
-
Haber, S. N., Ryoo, H., Cox, C. & Lu, W. Subsets of midbrain dopaminergic neurons in monkeys are distinguished by different levels of mRNA for the dopamine transporter: comparison with the mRNA for the D2 receptor, tyrosine hydroxylase and calbindin immunoreactivity. J. Comp. Neurol. 362, 400–410 (1995).
-
Inoue, K.-I. et al. Recruitment of calbindin into nigral dopamine neurons protects against MPTP-Induced parkinsonism. Mov. Disord. 34, 200–209 (2019).
-
Lavoie, B. & Parent, A. Dopaminergic neurons expressing calbindin in normal and parkinsonian monkeys. Neuroreport 2, 601–604 (1991).
-
McRitchie, D. A. et al. The midbrain dopaminergic cell groups in the baboon Papio ursinus. Brain Res. Bull. 47, 611–623 (1998).
-
West, M. J. Stereological methods for estimating the total number of neurons and synapses: issues of precision and bias. Trends Neurosci. 22, 51–61 (1999).
-
Wälchli, T. et al. Quantitative assessment of angiogenesis, perfused blood vessels and endothelial tip cells in the postnatal mouse brain. Nat. Protoc. 10, 53–74 (2015).
-
Gundersen, H. J., Jensen, E. B., Kiêu, K. & Nielsen, J. The efficiency of systematic sampling in stereology-reconsidered. J. Microsc. 193, 199–211 (1999).
-
Hovens, I. B., Nyakas, C. & Schoemaker, R. G. A novel method for evaluating microglial activation using ionized calcium-binding adaptor protein-1 staining: cell body to cell size ratio. Neuroimmunol. Neuroinflammation 1, 82–88 (2014).
Acknowledgements
The expert technical assistance with histology of Raquel Márquez Lopez and Maria Ciorraga is gratefully acknowledged. We are especially grateful to Cristina Gil, Jennifer Ribeiro, Juan Santos, and Eduardo Alvarez for ensuring our animals get the highest quality of care. We thank Lawrence Phillips, MD for English language editing of this manuscript. This research was funded in whole or in part by Aligning Science Across Parkinson’s [ASAP-020505] through the Michael J. Fox Foundation for Parkinson’s Research (MJFF). T.B. is currently funded by Ayudas para contratos Juan de la Cierva Incorporacion (IJC2020-043918-I) of the Ministry of Science and Innovation, the National Research Agency and the European Union NextGenerationEU/PRTR (Recovery, Transformation and Resilience Plan); N.L.G. by Ministerio de Educacion y Formacion Profesional PID2019-111045RB-100 and grant S2017/BMD-3700 (NEUROMETAB-CM) from Comunidad de Madrid; NEG by Instituto de Salud Carlos III PFIS (FI21/000919); J.A.O. by Ministerio de Ciencia e Innovación y Universidades (PID2019-111045RB-I00); and J.B. by Instituto de Salud Carlos III Miguel Servet Program (CP19/00200), FIS (PI23/00672), and Fundación Tatiana Pérez de Guzmán el Bueno.
Author information
Authors and Affiliations
Contributions
T.B., J.A.O., and J.B. conceptualized and designed the study. T.B., N.L.G., N.E.G., A.R.S., J.P.P., I.T.D., and J.B. developed the laboratory work. T.B., J.A.O., and J.B. provided resources. T.B., J.A.O., and J.B. performed the data curation, formal analysis, and wrote the original manuscript draft, which was reviewed and approved by all co-authors.
Corresponding authors
Ethics declarations
Competing interests
The authors declare no competing interests.
Additional information
Publisher’s note Springer Nature remains neutral with regard to jurisdictional claims in published maps and institutional affiliations.
Rights and permissions
Open Access This article is licensed under a Creative Commons Attribution 4.0 International License, which permits use, sharing, adaptation, distribution and reproduction in any medium or format, as long as you give appropriate credit to the original author(s) and the source, provide a link to the Creative Commons licence, and indicate if changes were made. The images or other third party material in this article are included in the article’s Creative Commons licence, unless indicated otherwise in a credit line to the material. If material is not included in the article’s Creative Commons licence and your intended use is not permitted by statutory regulation or exceeds the permitted use, you will need to obtain permission directly from the copyright holder. To view a copy of this licence, visit http://creativecommons.org/licenses/by/4.0/.
About this article
Cite this article
Balzano, T., del Rey, N.LG., Esteban-García, N. et al. Neurovascular and immune factors of vulnerability of substantia nigra dopaminergic neurons in non-human primates. npj Parkinsons Dis. 10, 118 (2024). https://doi.org/10.1038/s41531-024-00735-w
-
Received:
-
Accepted:
-
Published:
-
DOI: https://doi.org/10.1038/s41531-024-00735-w
This was shown first on: https://www.nature.com/articles/s41531-024-00735-w
