Single nucleus RNA-seq reveals cell type heterogeneity in human SNpc
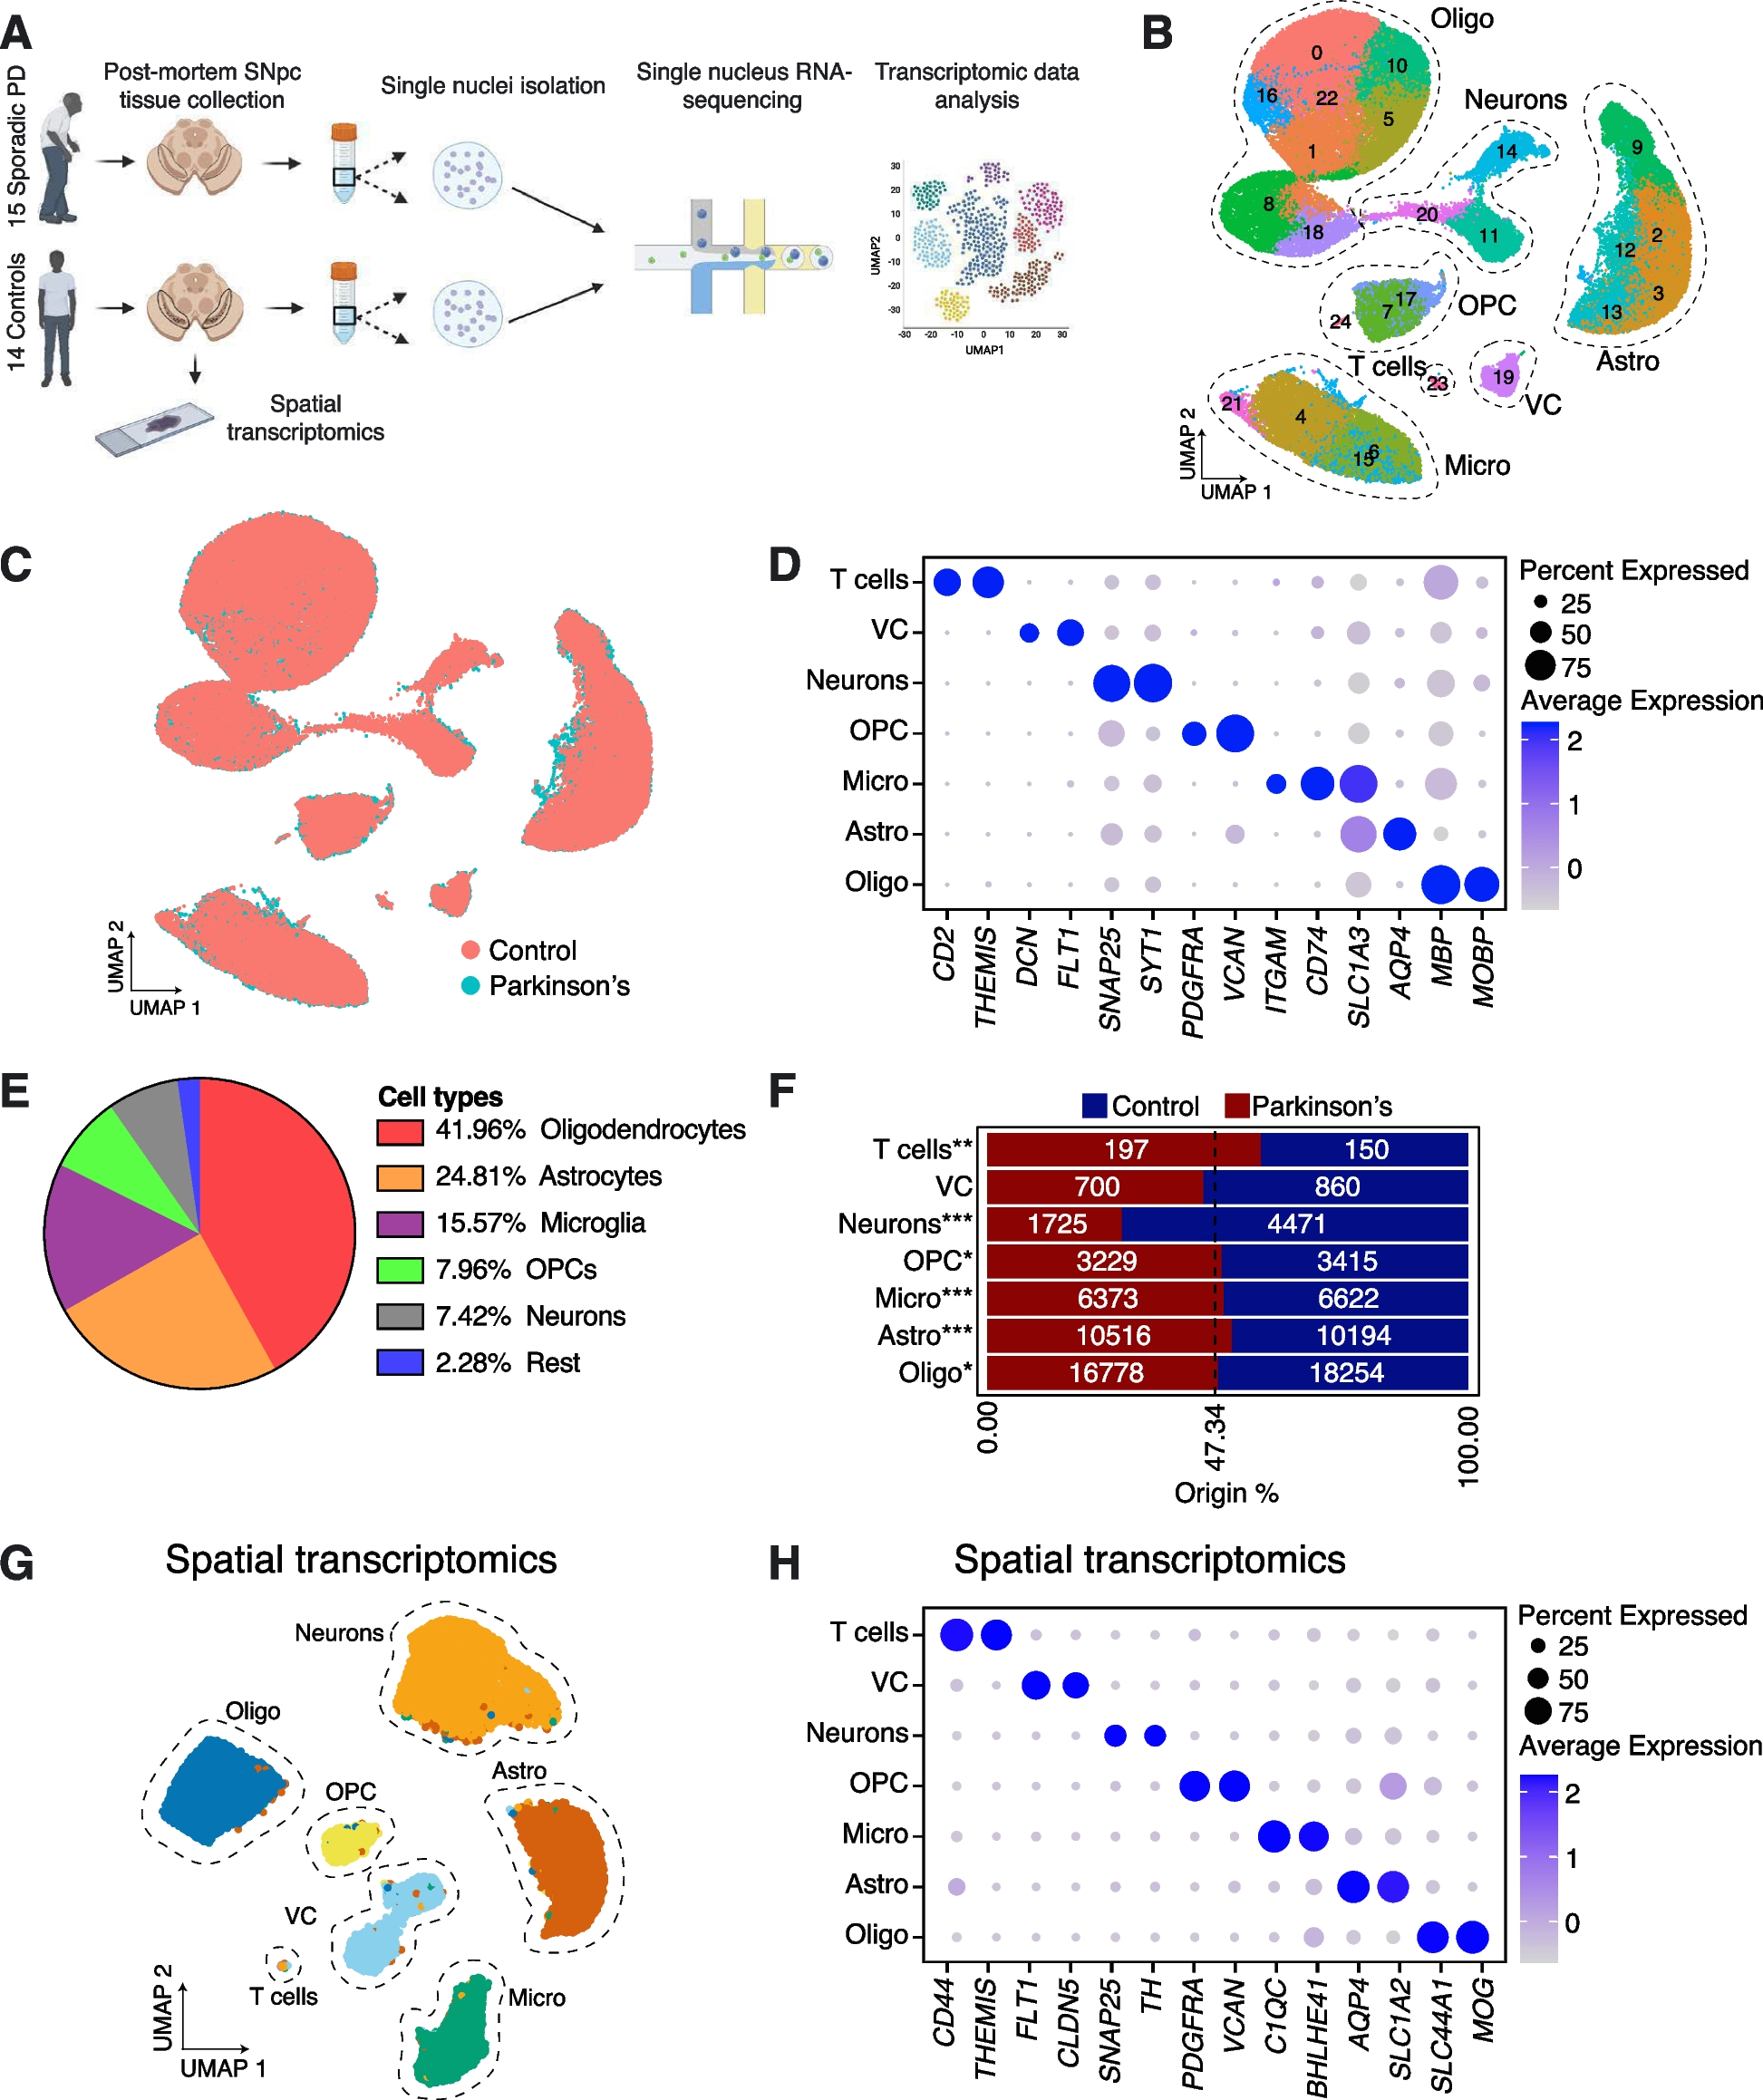
We sampled SNpc from post-mortem human brains of 15 sporadic Parkinson’s disease (PD) patients and 14 Control individuals (see Supplementary Table 1 for full pathology reports). Using a 10X Genomics Chromium platform, we performed single nucleus RNA-seq (snRNA-seq) on more than 80,000 high-quality nuclei from these 29 samples (Fig. 1A; Supplementary Table 2). UMAP dimensionality reduction on the merged PD and Control datasets showed that clustering was driven by inter-sample variability, as well as cell type identity. To control for inter-sample variability, we used an anchor-based integration approach to allow representative clustering and cell type identification. Louvain-based clustering identified 25 populations (Fig. 1B). Both PD and Control cells were found to be present within all cell clusters (Fig. 1C). We utilized a panel of markers to assign nuclei to various central nervous system (CNS) cell types, including neurons (SYT1 & SNAP25), astrocytes (AQP4 & SLC1A3), oligodendrocytes (MOBP & MBP), microglia (CD74 & ITGAM), vascular cells (VC) (FLT1 & DCN), oligodendrocyte progenitor cells (OPCs) (VCAN & PDGFRA) and T cells (THEMIS & CD2) (Fig. 1D; Supplementary Fig. 1A). We found that all the major cell types were detectable in multiple Control and PD samples (Supplementary Fig. 1B, Supplementary Table 2): 41.96% of all sampled cells were oligodendrocytes, with astrocytes and microglia representing 24.81% and 15.57% of the sample, respectively. We found that neurons made up 7.42% of cells, with OPCs at 7.96% and the remaining cell types representing 2.28% of the total cell population (Fig. 1E; Supplementary Table 3). These levels of cell recovery are consistent with other studies [6, 7], where cells were effectively captured at random from a single cell suspension and reinforce our belief that our dataset recapitulates the full range of cellular heterogeneity that can be captured using nuclei isolation and the 10X Chromium system (Supplementary Fig. 2).

Cell types in human substantia nigra parscompacta and their susceptibility to PD. A Schematic of the experimental design. Nuclei were isolated from sections of frozen post-mortem brain containing substantia nigra pars compacta (SNpc) from Control (14) and PD (15) donors. Sequencing libraries were then prepared using the 10X Genomics Chromium platform and sent for standard Illumina sequencing. Spatial transcriptomics was performed on slices of fresh frozen SNpc tissue; samples were taken from 3 Control donors and 3 sporadic PD patients, selected from the cohort of 29 brains used for sequencing (Supplementary Table 1). B UMAP-based clustering of 83,484 high quality nuclei obtained from 15 PD and 14 Control samples. Clusters representing neurons, oligodendrocytes (Oligo), astrocytes (Astro), microglia (Micro), oligodendrocyte progenitor cells (OPC), T cells and vascular cells (VC) were identified, based on the expression of known marker genes (see also Supplementary Fig. 1A). C UMAP showing how nuclei from PD and Control samples distribute across the different clusters. D Expression of cell markers used to identify higher level cell types in SNpc. E A pie chart showing the percentage of major cell types in our SNpc dataset. F Bar plots showing the relative number of nuclei per cluster originating from Control or PD samples against their predicted abundance (based on 47.34% of all nuclei originating from PD samples: dashed line). A Binomial test was performed to see if there is any significant divergence of cell proportions from this value, * p-value < 0.05, ** p-value < 0.0005, *** p-value < 0.00005. G Independent clustering of the spatial transcriptomics dataset. H Confirmation of cell type marker expression using spatial transcriptomics
As expected, evaluation of relative cell proportions showed that neurons are heavily depleted in PD samples, whereas the relative proportions of glial and T cells appear to increase (Fig. 1F). To confirm the presence of these cell types, we performed multiplexed spatial transcriptomics (Molecular Cartography by Resolve Biosciences), using a panel of cell type-specific markers (Supplementary Table 4). Clustering analysis of this data confirmed the presence of all the cell types detected by snRNA-seq (Fig. 1G, H).
Neuronal subpopulations in aged human SNpc and their response in sporadic PD
To investigate PD-affected neuronal cell types, we re-clustered the neuronal population, revealing 6 distinct subpopulations, characterized by unique gene expression patterns, which we termed Neurons0—Neurons5 (Fig. 2A). All subpopulations were present in multiple PD and Control samples (Fig. 2B, Supplementary Table 2). Importantly, however, the numbers of cells in Neurons0 and Neurons3 were significantly lower in PD samples compared to Controls, whereas Neurons2 and Neurons4 were significantly over-represented in PD samples (Fig. 2C). To characterize these neuronal populations, we performed pathway over-representation analysis on the full list of marker genes for the various subpopulations (significantly enriched genes with ln-fold change > 0.25 and adjusted p-value < 0.05; Supplementary Table 5).

Neuronal subpopulations found in human substantia nigra pars compacta and their response to PD. A Re-clustering of neurons identified in Fig. 1B. B Proportion of nuclei coming from Control (blue) or PD (red) donors per neuronal type reported in Fig. 2A. Different shades of blue and red represent different donors. C A comparison of nuclei number (expressed as a percentage) deriving from PD or Control brains against their predicted abundance (based on 27.96% of all nuclei originating from PD samples: dashed line). A Binomial test was performed to see if there is any significant divergence of cell proportions from this value, * p-value < 0.05, ** p-value < 0.0005, *** p-value < 0.00005. D Selected marker genes for neuronal populations reported in Fig. 2A. The full list of marker genes is reported in Supplementary Table 5. E A summary of pathway over-representation analysis using the marker genes defining neuronal populations 0–5. Two Sankey diagrams are shown which illustrate the relationships between the various neuronal subpopulations and relevant cellular pathways identified (listed in Supplementary Table 6 in the column labeled “Group”). The thickness of the grey interconnecting lines is proportional to the number of individual pathways falling within a particular functional group that is significantly over-represented among the markers of a given cellular subpopulation, normalized to the number of pathways displayed per Sankey plot. F A stripe chart reporting the number of significantly up- or downregulated genes in nuclei originating from PD donors (compared to Controls) per neuronal subpopulation, found by fitting a linear mixed model. Red dots correspond to genes that are up- (coefficient > 0) or downregulated (coefficient < 0), with an adjusted p-value < 0.1 (ANOVA test with Benjamini–Hochberg correction). The full list of the up- and downregulated genes is reported in Supplementary Table 7. G A volcano plot reporting genes up- (cyan) or downregulated (orange) in nuclei originating from PD donors (compared to Controls) and assigned to subpopulation Neurons0. H Pathways over-represented by up- or downregulated genes in nuclei originating from PD donors (compared to Controls) and assigned to subpopulation Neurons0, as reported in Supplementary Table 8
We found Neurons0 to be characterized by key markers associated with dopaminergic neurons, including TH, SLC6A3, SNCA, and ALDH1A1 (Fig. 2D), highlighting that the primary subpopulation lost in PD samples is DA neurons. We also observed the expression of other dopaminergic markers, such as SLC18A2 and KCNJ6 (Fig. 2D). Paternally expressed gene 10 (PEG10), a DNA-binding protein coding gene, was another notable highly expressed cell marker [9] (Fig. 2D). We also observed high expression of AGTR1 in this population (Supplementary Fig. 3), which has previously been linked to a subpopulation of DA neurons highly vulnerable to PD [8]. Pathway analysis of subpopulation marker genes showed over-representation of key cellular processes known to be implicated in PD pathology, such as energy production (e.g., ATP1B1, ENO1 and ENO2), cholesterol metabolism (e.g., DHCR24, CYB5R3 and HDLBP), iron transport (e.g., FTL, FTH1 and SLC22A17), oxidative stress (e.g., CHCHD10, CLU and SOD1) and transcripts linked to the UPR (including chaperones, e.g., HSPA8 and HSP90AA1) (Fig. 2D, E; Supplementary Fig. 3; Supplementary Table 6). Next, we examined differentially expressed genes (DEG) between PD and Control samples for this population of DA neurons and found 20 significant DEGs (Fig. 2F; Supplementary Table 7). Pathway analysis on up- or downregulated genes (PD vs Control) within this population suggests perturbations in sugar/glucose metabolism, due to the downregulation of O-GlcNAcase (OGA) and carbohydrate sulfotransferase 1 (CHST1), which is reported to be an early event in sporadic PD [10] (Fig. 2G, H; Supplementary Table 8). KBTBD6, involved in proteosome-mediated ubiquitin-dependent protein catabolic processes, was also downregulated, while dysregulation of the genes encoding Ras-related RAB6B, RAB8B and Component of Oligomeric Golgi Complex 4 (COG4) is consistent with dysfunction of Golgi to endoplasmic reticulum (ER) vesicle trafficking (Fig. 2G, H; Supplementary Table 8). These results are in line with recent reports of disrupted vesicle trafficking in PD, caused by the accumulation of alpha-synuclein, and the potential of RAB GTPases to rescue neurons from death [11,12,13].
Neurons3 represents a second neuronal population, which was found to be significantly depleted in PD samples. We found that cells in this population were characterized by the expression of key GABAergic markers, such as GAD1, GAD2, GABRA1 and GABRB2, indicating a putative inhibitory identity (Fig. 2D, Supplementary Table 5). This population also expressed members of the heat shock protein family (HSPA and HSP90), as well as genes associated with dopamine secretion/metabolic processes/transport (e.g., SYT11, KCNA2 and ABAT) (Supplementary Table 6). In addition, Neurons3 and Neurons0 both express markers associated with the UPR, oxidative stress, energy production and iron transport (Fig. 2E; Supplementary Table 6), suggesting underlying mechanisms for the shared vulnerability to cell death in PD. Differential gene expression analysis between PD and Control samples for Neurons3 showed upregulation of NEAT1 and CA2 (Fig. 2F; Supplementary Table 7). NEAT1 encodes a long non-coding RNA previously shown to be upregulated in PD [14]. Elevated CA2 levels in mitochondria have been associated with aging and neurodegeneration [15, 16].
We also explored the gene expression profiles of Neurons2 and Neurons4, which were both over-represented in PD samples (Fig. 2C). We observed the strongest expression of SLC44A1, the gene encoding the choline transporter-like protein 1, in Neurons4, whereas Neurons2 had the highest expression of serotonin 5-HT-2C receptor (HTR2C) (Fig. 2D). In contrast to PD-depleted dopaminergic Neurons0 and GABAergic Neurons3, the markers of the remaining neuronal populations do not show over-representation of processes related to the UPR, but do show enrichment in GTPase activity (Fig. 2E). Calmodulin-dependent protein kinase II gamma (CAMK2G) was differentially upregulated in PD Neurons2, while we found ANAPC16, HP1BP3 and SEPT8 differentially upregulated in PD Neurons4, compared to Controls (Fig. 2F; Supplementary Table 7).
Astrocyte subpopulations in aged human SNpc and their responses in sporadic PD
Extracting and re-clustering the astrocytes revealed 6 subpopulations, which we termed Astrocytes0—Astrocytes5 (Fig. 3A). All subpopulations were represented in multiple PD and Control samples (Fig. 3B, Supplementary Table 2). However, the numbers of cells in Astrocytes1, Astrocytes3, Astrocytes4 and Astrocytes5 were significantly over-represented in PD samples, while the number of cells in Astrocytes2 was significantly lower in PD samples compared to Controls (Fig. 3C).

Astrocyte subpopulations found in human substantia nigra pars compacta and their response to PD. A Re-clustering of astrocytes identified in Fig. 1B. B Proportion of nuclei coming from Control (blue) or PD (red) patients per subpopulation reported in Fig. 3A. Different shades of blue and red represent different donors. C A comparison of nuclei number (expressed as a percentage) deriving from PD or Control brains against their predicted abundance (based on 53.37% of all nuclei originating from PD samples: dashed line). A Binomial test was performed to see if there is any significant divergence of cell proportions from this value, * p-value < 0.05, ** p-value < 0.0005, *** p-value < 0.00005. D Selected marker genes for astrocyte subpopulations reported in Fig. 3A. The full list of marker genes is reported in Supplementary Table 5. E A summary of pathway over-representation analysis using the marker genes defining astrocyte populations 0–5. Two Sankey diagrams are shown which illustrate the relationships between the various astrocyte subpopulations and relevant cellular pathways identified (listed in Supplementary Table 6 in the column labeled “Group”). The thickness of the grey interconnecting lines is proportional to the number of individual pathways falling within a particular functional group that is significantly over-represented among the markers of a given cellular subpopulation, normalized to the number of pathways displayed per Sankey plot. F A stripe chart reporting the number of significantly up- or downregulated genes in nuclei originating from PD donors (compared to Controls) per astrocyte subpopulation, found by fitting a linear mixed model. Red dots correspond to genes that are up- (coefficient > 0) or downregulated (coefficient < 0), with an adjusted p-value < 0.1 (ANOVA test with Benjamini–Hochberg correction). The full list of genes up- and downregulated in the various astrocyte subpopulations isolated from PD patients is reported in Supplementary Table 7. G A volcano plot reporting genes up- (cyan) or downregulated (orange) in nuclei originating from PD donors (compared to Controls): the astrocyte populations showing the most significant responses (Astrocytes0, Astrocytes3 and Astrocytes4) are shown. H Pathways over-represented by up- or downregulated genes in nuclei originating from PD patients (compared to Controls) and assigned to subpopulations Astrocytes0, Astrocytes3 and Astrocytes4, as reported in Supplementary Table 8
Marker gene analysis revealed that Astrocytes2 showed enrichment for key genes linked to dopamine metabolism, including SLC6A3, SNCA, and importantly TH, suggesting that the vulnerability of TH enriched neurons in PD may be extended to other cell types (Fig. 3D, E). We also observed that the Astrocytes2 subpopulation expressed transcripts involved in ubiquitination (e.g., UBB and UBC), as well as transcripts associated with endocytic vesicle trafficking, protein folding (e.g., HSP90AA1, HSP90AB1 and HSPA8), and JUN & FOS signaling, suggesting activation of apoptosis (Fig. 3D, E; Supplementary Fig. 4; Supplementary Tables 5, 6).
We observed that the Astrocytes3 subpopulation was mostly found in patients diagnosed with PD, suggesting that this astrocyte state may be PD-specific (Fig. 3C). Pathway over-representation analysis, using the specific marker genes identified for this subpopulation, identified pathways predominantly associated with the metabolism of fatty acids (e.g., PTGES3, ABHD3, ADIPOR2 and ABHD2) and the UPR (e.g., BAG3, SERPINH1, DNAJB1 and HSPB1) (Fig. 3D, E; Supplementary Table 6), suggesting a reactive-astrocyte identity [17]. Differential gene expression analysis between PD and Controls showed downregulation of genes involved in the serine-threonine signaling cascade (PPP2R2B and SPRED1), and the upregulation of genes associated with the ubiquitin ligase complex (ANAPC16 and KLHL24) (Fig. 3G, H; Supplementary Tables 7, 8).
Pathway analysis on the cell markers defining Astrocytes5 highlighted biological processes including axon development, axon ensheathment, development of neuronal projections and synapse organization, suggesting that this subpopulation has an active role in neuronal maintenance and survival (Supplementary Table 6). In PD samples, differential gene expression analysis showed downregulation of CYP7B1, a gene involved in lipid homeostasis, and upregulation of PTOV1, a gene known to promote cell proliferation, in this subpopulation [18] (Fig. 3F; Supplementary Table 7).
The well-known markers of reactive astrocytes, C3 and CD44, are more enriched in Astrocytes1, a subpopulation likely to represent another reactive astrocyte state [19,20,21] (Fig. 3D). Genes involved in glutamate metabolism and synapse assembly were also highly expressed in this astrocyte population (Fig. 3E; Supplementary Table 6). Pathway analysis on the DEGs in Astrocytes1 between PD and Control samples indicated the dysregulation of tumor necrosis factor (TNF)-mediated signaling (CCDC3 and NOL3) in PD (Fig. 3F; Supplementary Table 7).
Astrocytes4 was enriched in PD samples and expressed high levels of various metallothionein genes (e.g., MT2A, MT1E and MT3) (Fig. 3D). This astrocyte subpopulation also highly expresses GFAP, a canonical marker of astrogliosis [22] (Fig. 3D). Astrocytes4 also has the highest expression of APOE, MT3 and CLU, which are associated with mitochondrial changes, oxidative stress and immune response-related processes (Fig. 3D, E; Supplementary Fig. 4). At the level of differential gene expression between cells obtained from PD and Control samples, we found upregulation of T cell activity, lipid metabolism and ion transport in PD samples compared to Controls, in this subpopulation (Fig. 3H; Supplementary Table 8).
Microglia subpopulations in aged human SNpc and their response in sporadic PD
We next explored the molecular profiles of microglia subpopulations affected in sporadic PD. Re-clustering analysis of microglia revealed 6 subpopulations, which we named Microglia0—Microglia5 (Fig. 4A). All subpopulations were represented in multiple PD and Control samples (Fig. 4B, Supplementary Table 2).

Microglia subpopulations found in human substantia nigra pars compacta and their response to PD. A Re-clustering of microglia identified in Fig. 1B. B Proportion of nuclei coming from Control (blue) and PD (red) patients per subpopulation reported in Fig. 4A. Different shades of blue and red represent different donors. C A comparison of nuclei number (expressed as a percentage) deriving from PD or Control brains against their predicted abundance (based on 50.19% of all nuclei originating from PD samples: dashed line). A Binomial test was performed to see if there is any significant divergence of cell proportions from this value, * p-value < 0.05, ** p-value < 0.0005, *** p-value < 0.00005. D Selected marker genes for microglial populations shown in Fig. 4A. The full list of marker genes is reported in Supplementary Table 5. E A summary of pathway over-representation analysis using the marker genes defining microglia populations 0–5. Two Sankey diagrams are shown which illustrate the relationships between the various microglia subpopulations and relevant cellular pathways identified (listed in Supplementary Table 6 in the column labeled “Group”). The thickness of the grey interconnecting lines is proportional to the number of individual pathways falling within a particular functional group that is significantly over-represented among the markers of a given cellular subpopulation, normalized to the number of pathways displayed per Sankey plot. F A stripe chart reporting the number of significantly up- or downregulated genes in nuclei originating from PD donors (compared to Controls) per microglial subpopulation, found by fitting a linear mixed model. Red dots correspond to genes that are up- (coefficient > 0) or downregulated (coefficient < 0), with an adjusted p-value < 0.1 (ANOVA test with Benjamini–Hochberg correction). The full list of genes up- or downregulated in the various microglia subpopulations isolated from PD patients is reported in Supplementary Table 7. G Volcano plots reporting genes up- (cyan) or downregulated (orange) in nuclei originating from PD donors (compared to Controls): two microglia populations (Microglia1 and Microglia3) are shown. H Pathways over-represented by up- or downregulated genes in nuclei from PD patients (compared to Controls) and assigned to subpopulations Microglia1 and Microglia3, as reported in Supplementary Table 8
As with astrocytes, we saw that one population, Microglia1, was significantly depleted in samples from patients diagnosed with sporadic PD (Fig. 4C). Marker gene analysis again revealed that this was the only microglia population enriched in markers involved in dopamine metabolism, including TH (Fig. 4D, E; Supplementary Fig. 5; Supplementary Tables 5, 6). Furthermore, this population expresses a high number of transcripts linked to processes involved in the UPR (e.g., HSP90AA1, HSP90AB1 and HSPA8), like we observed for Astrocytes2 (Fig. 4D, E). Similarly, Microglia1 was also positive for markers associated with apoptosis (e.g., FOS and ACTG1) (Fig. 4D, E). A high number of differentially expressed genes was observed between PD and Control samples (Fig. 4F; Supplementary Table 7). Of particular interest, Microglia1 shows upregulated expression of acetyltransferase activity (KAT2B, ATF2 and MCM3AP) in PD, which is known to be involved in inflammatory responses in microglia [23] (Fig. 4H; Supplementary Table 8).
Among the markers of Microglia2, P2RY12 stands out as a P2Y receptor involved in microglial motility and migration towards (damaged) cells releasing ATP, an initiating event in neuroinflammation [24] (Fig. 4D). Furthermore, DOCK8, a neuroinflammation-associated gene, was also highly expressed in Microglia2 (Fig. 4D), which also expressed ARHGAP family transcripts (including ARHGAP22 and ARHGAP15), which are known to be linked to alterations in the microglial activation state upon aging [25, 26]. Together, this suggests that Microglia2 may represent a pro-inflammatory subset of microglia, central to the neuroinflammatory response seen in PD.
Microglia4 was characterized by the high expression of APOE and SPP1 (Fig. 4D). Microglia4 is the only subpopulation of microglia that expressed a high level of APOE (Fig. 4D). Microglia4 also appears to represent a population of reactive microglia, expressing genes involved in the complement cascade (e.g., C1QC, C1QB and C1QA), the human leukocyte antigen (HLA) system (e.g., HLA-DRA and HLA-DRB1), the UPR (e.g., HSP90 and HSPA), and the oxidative stress response (e.g., HSPA1A, TREM2, GSTP1 and HSPB1) (Fig. 4D, E). Microglia2 and Microglia4 do not show significant differential expression of genes between PD and Control conditions (Fig. 4F; Supplementary Table 7).
Microglia3 was characterized by expression of ABCA1, MITF and STARD13 (Fig. 4D). This subpopulation is the only microglial subpopulation that expressed high levels of SRGAP1, SH3PXD2A and RGL1 (Fig. 4D). Differential gene expression analysis between PD and Controls showed downregulation of genes involved in GTPase activity (DOCK1, AGFG1 and ASAP1), and dysregulation of ubiquitin activity (PELI1 and CXCR4) (Fig. 4G, H; Supplementary Tables 7, 8).
Oligodendrocyte subpopulations in aged human SNpc and their response in sporadic PD
We also performed re-clustering on the oligodendrocyte population, revealing 6 subpopulations, which we named Oligos0 – Oligos5 (Fig. 5A). All subpopulations were represented in multiple PD and Control samples (Fig. 5B, Supplementary Table 2). However, the numbers of cells in Oligos2 and 5 were significantly lower in PD samples compared to Controls, whereas Oligos0, Oligos1 and Oligos3 were significantly enriched in PD. Oligos4 was not significantly changed between PD and Control (Fig. 5C).

Oligodendrocyte subpopulations found in human substantia nigra pars compacta and their response to PD. A Re-clustering of oligodendrocytes identified in Fig. 1B. B Proportion of nuclei coming from Control (blue) and PD (red) patients per subpopulation reported in Fig. 5A. Different shades of blue and red represent different donors. C A comparison of nuclei number (expressed as a percentage) deriving from PD or Control brains against their predicted abundance (based on 47.89% of all nuclei originating from PD samples: dashed line). A Binomial test was performed to see if there is any significant divergence of cell proportions from this value, * p-value < 0.05, ** p-value < 0.0005, *** p-value < 0.00005. D Selected marker genes for oligodendrocyte subpopulations shown in Fig. 5A. The full list of marker genes is reported in Supplementary Table 5. E A summary of pathway over-representation analysis using the marker genes defining oligodendrocyte populations 0–5. Two Sankey diagrams are shown which illustrate the relationships between the various oligodendrocyte subpopulations and relevant cellular pathways identified (listed in Supplementary Table 6 in the column labeled “Group”). The thickness of the grey interconnecting lines is proportional to the number of individual pathways falling within a particular functional group that is significantly over-represented among the markers of a given cellular subpopulation, normalized to the number of pathways displayed per Sankey plot. F A stripe chart reporting the number of significantly up- or downregulated genes in nuclei originating from PD donors (compared to Controls) per oligodendrocyte subpopulation, found by fitting a linear mixed model. Red dots correspond to genes that are up- (coefficient > 0) or downregulated (coefficient < 0), with an adjusted p-value < 0.1 (ANOVA test with Benjamini–Hochberg correction). The full list of genes up- or downregulated in the various oligodendrocyte subpopulations isolated from PD patients is reported in Supplementary Table 7. G Pathways over-represented by up- or downregulated genes in nuclei originating from PD donors (compared to Controls) and assigned to the oligodendrocyte subpopulations, as reported in Supplementary Table 8
Like Astrocytes2 and Microglia1, Oligos2 represents a population enriched for TH, SLC6A3 and SNCG (genes associated with dopamine metabolism) and it is largely depleted in sporadic PD samples (Fig. 5C, D, E). This population is also enriched in transcripts linked to axon development and synapse organization (e.g., UCHL1, NEFL, MAP1B and NRXN3), transcripts linked to ion transport (e.g., CNTN1 and ANK3) and the synaptic vesicle cycle (e.g., SLC18A2 and CALY) (Fig. 5D, E; Supplementary Fig. 6; Supplementary Tables 5, 6). Interestingly, unlike TH enriched astrocytes and microglia, this TH enriched oligodendrocyte population does not show enrichment for genes involved in unfolded protein or oxidative stress responses (Fig. 5E). All oligodendrocyte subpopulations show a strong response in differential gene expression between PD and Control samples (Fig. 5F; Supplementary Table 7). Among them, Oligos2 demonstrates upregulation of genes linked to spliceosome function (RBM22, PRPF8 and HNRNPU), ion channel activity (WNK1 and ENSA), serine/threonine kinase activity (CDKN1B and CDKN1C) and chaperone binding (BIRC2 and SYVN1) (Fig. 5G, Supplementary Tables 7, 8). Moreover, Oligos2 also shows up-regulation of CAMK2G, consistent with the dysregulation of calcium homeostasis and alterations in calmodulin-dependent protein kinase signaling observed in PD [27] (Supplementary Table 7). In addition, expression of the translocase of outer mitochondrial membrane 40 gene (TOMM40) was also dysregulated (Supplementary Table 7). The protein encoded by this gene is localized in the outer membrane of mitochondria and is the channel-forming subunit of a translocase complex essential for the import of protein precursors [28].
The second population of oligodendrocytes depleted in sporadic PD is Oligos5 (Fig. 5C). Oligos5 highly expresses CRYAB, a small heat shock protein, which is implicated in various protein aggregation-related neurodegenerative diseases, such as PD, Alzheimer’s disease (AD), amyotrophic lateral sclerosis (ALS) and prion disorders [29] (Fig. 5D). Like Microglia4, Oligos5 has high expression of FTL and FTH1, genes which encode proteins involved in iron storage (Fig. 5D). Oligos5 also highly expresses S100B, which has been associated with the glial stress response in the midbrain of PD patients [6] (Fig. 5D). Pathway over-representation analysis on the markers of this population shows enrichment of terms related to oxidative stress (e.g., CRYAB, MT3, SELENOP and MAP1LC3A), the response to protein aggregates (e.g., CLU, HSPA2, HSPA1A and HSP90AB1), ATP biosynthesis (e.g., ATP5ME, ATP5F1E and ATP5MC2), mitochondrial function (e.g., MT3, UBB, UBC and UBA52) and apoptosis (e.g., FIS1, UBB, RACK1, RPS3 and NUPR1) (Fig. 5D, E; Supplementary Fig. 6; Supplementary Tables 5, 6). At the differential gene expression level, Oligos5 isolated from PD samples shows upregulation of hypoxanthine guanine phosphoribosyltransferase (HPRT1) and TRF1-interacting ankyrin-related ADP-ribose polymerase 2 (TNKS2), which are both involved in regulating pentosyltransferase activity (Fig. 5G; Supplementary Table 8).
Oligos1 is more highly represented in PD samples than Controls and highly expresses RBFOX1, a dosage-sensitive gene whose disruption is associated with neurodevelopmental conditions and synaptic transmission, through its critical role in the control of mRNA splicing [30] (Fig. 5D). Oligos1 does not show strong enrichment for transcripts linked to myelination, vesicle trafficking or synapse assembly processes (Fig. 5E). Between PD and Control conditions, differential gene expression analysis identifies genes associated with GO/KEGG terms including RNA polymerase complex function (e.g., GTF2F2, POLR3G, GTF2H3 and CCNH), serine/threonine phosphatase activity (e.g., PPP2R2B, PPP4R2, PPP2R2C and PPP3CA), histone acetyltransferase complex function (e.g., CREBBP, EP300, JADE2 and TAF4), protein ubiquitination (e.g., ANAPC16, FBXW8, SKP2 and KLHL21) and lysosomal activity (e.g., DMXL1, ARSB and SORT1) (Fig. 5G; Supplementary Table 8).
Oligos3 is another oligodendrocyte subpopulation that is significantly over-represented in PD samples (Fig. 5C). Oligos3 expresses high levels of OPALIN, a marker of myelinating oligodendrocytes [6] (Fig. 5D). Pathway analysis on marker genes for Oligos3 shows strong enrichment for transcripts involved in synapse assembly (Fig. 5E). At the level of differential gene expression, various transcripts in Oligos3 showed either upregulation or downregulation in PD samples, when compared to Controls. Upregulated genes include several involved in MAP kinase activity (MAP3K7 and MAP3K2) and microtubule organization (SUN2 and MID1); downregulated genes include those involved in fatty acid metabolism (ACSL4), oxidative stress (ENOX2) and the serine/threonine signaling pathway (PTPDC1) (Fig. 5G; Supplementary Table 8).
PD-associated genes and genes near PD-associated variants show cell type-specific expression patterns
Genetic factors play a role in the development of Parkinson’s disease. Although genetic methods and population studies, including genome-wide association studies (GWAS), have identified various monogenic variants and susceptibility loci for PD, it remains to be shown whether these monogenic PD genes, or genes-associated with these loci, are specific to SNpc cell types (or their subpopulations).
In our study, we first explored the cell type specificity of a set of high-confidence genes associated with monogenic PD reported in [31]. We observed that certain genes exhibit cell type-specific enrichment (Fig. 6A). For instance, SNCA showed enrichment in neurons and microglia, LRRK2 in microglia and OPC, DNAJC6 in neurons and oligodendrocytes, and VPS13C in microglia and T cells (Fig. 6A). Several monogenic PD genes demonstrated significant enrichment specifically in neurons, such as PARK7, PINK1, ATP13A2, VPS35 and SYNJ1 (Fig. 6A). Moreover, amongst all neuronal subtypes, most of the monogenic PD genes investigated show significant enrichment in the DA neuronal population Neurons0 (DNAJC6, SNCA, PARK7, PINK1, ATP13A2, VPS35 and SYNJ1). Additionally, DNAJC6 showed enrichment in Astrocytes5 and Microglia5, SNCA in Astrocytes2 and Astrocytes5, and VPS35 in Neurons3. In contrast, PRKN shows enrichment in all neuronal subpopulations except Neurons0 and Neurons3 (Supplementary Fig. 7A). Furthermore, we were able to confirm some of these findings using spatial transcriptomics on independent tissue sections obtained from the same donors sampled in our snRNA-seq analysis, such as SNCA and ATP13A2 enrichment in neurons and LRRK2 enrichment in microglia (Supplementary Fig. 7B, Supplementary Table 5). However, no significant enrichment of LRRK2 in OPC was observed, possibly due to the small size of the OPC population detected in our spatial data.

PD-associated genes and genes near PD-associated variants show cell type-specific expression patterns. A Cell type enriched expression of high-confidence genes associated with monogenic PD. Ln-fold change of SCT-normalized counts is shown (Wilcoxon test, *FDR-corrected p-value < 0.05; see Supplementary Table 5). B–F Pseudo-Manhattan plots of the genes near PD-associated variants generated by MAGMA on the GWAS dataset curated by Nalls and colleagues [32]. The top differentially expressed genes per population/subpopulation which show significant association with PD variants (MAGMA p-value lower than 0.001, ln-fold change > 0.3 for population-level analysis, and ln-fold change > 0.25 for subpopulation-level analysis) are shown; VC, vascular cells; OPC, oligodendrocyte progenitor cells; Micro, microglia; Astro, astrocytes; Oligo, oligodendrocytes. G The number of cell type enriched marker genes that are also near PD-associated variants. The results of two-sided Binomial tests are shown at the top (ns = non-significant). The dashed line shows the expected number of markers given the null hypothesis (see ‘Methods’ and Supplementary Table 9)
Although the caveats of GWAS studies are increasingly recognized, we attempted to identify genes near PD-associated variants in our data by cross-referencing to the largest PD GWAS dataset publicly available at the time we conducted our study [32]. This dataset, curated by Nalls and colleagues, contains data collected over 17 studies, and reports 7.8 million single nucleotide polymorphisms (SNPs) identified in 37,688 diagnosed PD cases, 18,618 proxy-cases (individuals who do not have PD but have a first degree relative who does) and 1.4 million Controls. We predicted 203 genes to be highly associated with GWAS SNPs using Multi-marker Analysis of GenoMic Annotation (MAGMA) analysis (Supplementary Table 9). In this analysis, we also observed an overlap of MAGMA identified genes with the markers of distinct cell types we identified in our SNpc dataset (Fig. 6B-F, Supplementary Fig. 7C). Specifically, neuronal cell markers exhibited an overlap with genes near PD-associated variants in GWAS, such as SNCA; microglia cell markers with P2RY12 and LRRK2; and OPC cell markers with LRRK2 (Fig. 6B, C, F; Supplementary Table 9). We further explored the association of genes near PD-associated variants at the subpopulation level and found that several subpopulations also displayed association with these genes. For instance, PD depleted Neurons0 and Microglia2 exhibited an association with SNCA and P2RY12, respectively (Fig. 6B, C). Binomial testing did not reveal significant enrichment of the GWAS PD-associated-variant-proximal genes in any specific cell type (Fig. 6G), which could be due to the inherent uncertainty in assigning causal genes to GWAS lead variants. Overall, our analyses reveal that cell (sub)populations show an association with at least a handful of genes near PD GWAS SNPs, as identified through MAGMA analysis, and display enrichment in several monogenic PD genes, consistent with a complex interplay between cells contributing to disease pathogenesis.
TH among several common genes enriched in cell types depleted in sporadic PD samples
Along with our analyses showing a strong depletion of TH enriched neurons in sporadic PD, we also tentatively identified TH enriched astrocyte, microglia and oligodendrocyte subpopulations that appear depleted in PD. To try and increase the robustness of this finding we took two independent approaches. First, we analysed the largest snRNA-seq dataset currently available of human substantia nigra tissue (obtained from cohorts of Controls and PD patients independent of our study), which was published by Kamath and colleagues [8]. Analysis revealed that although the correspondence of subpopulations detected in the individual datasets was not entirely comparable (Supplementary Figs. 8, 9, 10), it was possible not only to detect the presence of TH-positive (TH +) glia in the Kamath et al. dataset but also observe that these cells were depleted in samples from PD donors (Supplementary Figs. 8C, 9C, 10C). To investigate possible shared molecular mechanisms of action, we compared the gene expression profiles of the four TH enriched subpopulations. First, we compared the levels of TH expression across these cell types and observed that TH enriched glial cells expressed TH at a relatively low level compared to DA neurons (Fig. 7A; Supplementary Fig. 11). We re-confirmed the identity of these subpopulations using a panel of higher-level cell type markers. For example, Oligos2 is enriched in oligodendrocyte markers (MBP and MOBP) and TH (Fig. 7A). Furthermore, we also observed a relatively lower percentage of the glia populations expressing TH compared to dopaminergic Neurons0 (Fig. 7A). We next identified 28 cell markers that are shared between the depleted TH enriched cell types (Fig. 7B, C; Supplementary Table 10). We compared the expression of these genes across the PD depleted TH enriched subpopulations and again found them to be expressed at lower levels in glia compared to dopaminergic neurons (Fig. 7C). GO term pathway analysis on these shared genes demonstrated enrichment in pathways involved in dopaminergic neurogenesis (e.g., ALDH1A1, SLC6A3, SLC18A2 and TH), neurofilament assembly (e.g., NEFM, NEFH and NEFL), regulation of neurotransmitter levels and transport (e.g., SLC6A3, SLC18A2, SNAP25 and SNCG) and synaptic signalling (MAP1B and YWHAG) (Fig. 7D, Supplementary Table 10). We confirmed TH expression in all major cell types resident in the SNpc using spatial transcriptomics with single cell resolution (Molecular Cartography) on tissue sections obtained from Control and PD donors (see ‘Methods’). Consistent with the results obtained using single nucleus sequencing, we found that glial cells in general express lower amounts of TH transcripts compared to neurons (Fig. 7E, F).

Molecular similarities between tyrosine hydroxylase (TH) enriched cell types depleted in the substantia nigra pars compacta of PD patients. A TH expression comparison between dopaminergic Neurons0 and TH enriched glial cell types (Astrocytes2, Microglia1 and Oligos2). Higher level cell markers were used to confirm the identity of these subpopulations. B Venn diagram showing overlap of cell markers defining dopaminergic Neurons0 and TH enriched glial cell types. C Gene expression levels of cell markers shared between dopaminergic Neurons0 and TH enriched glial cell types. D GO term pathway analysis on the shared cell markers. E Representative images from spatial transcriptomics experiments showing the presence of SNAP25, SLC6A3 and TH transcripts (dots) in higher-order cell types (represented as polygons). Astro, astrocytes; VC, vascular cells; Micro, microglia; Oligo, oligodendrocytes; OPC, oligodendrocyte progenitor cells. Scale bar, 50 µm. F Gene expression levels for shared cell markers of higher-order cell types determined by spatial transcriptomics. Violin plots of SCT-normalized data are shown
Get the source article here